

When US inflation data comes out during London hours, a USD/ZAR trader in Gauteng may see prices jump.
It is hard to tell if this move shows new information or if the market already expected it.
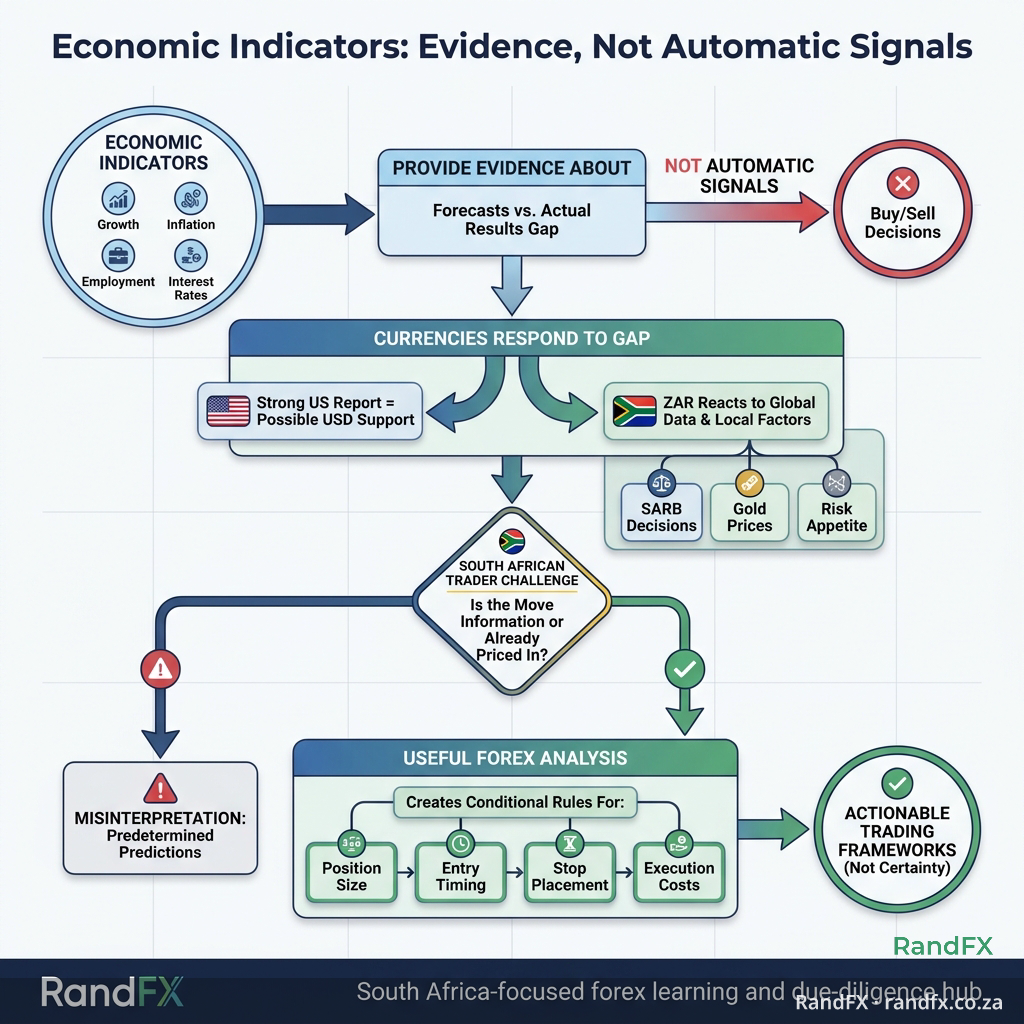
Economic indicators do not tell you to buy or sell automatically.
They show facts about growth, inflation, jobs, and interest rates. Currencies change based on how actual results differ from predictions.
South African traders need to know this because the Rand reacts to global news, South African Reserve Bank moves, gold prices, and shifts in risk appetite.
A strong US report may boost the dollar, but higher gold prices or hawkish local rate outlooks can push USD/ZAR down.
Good forex market analysis asks what the release means for ZAR exposure and what would prove it wrong.
This turns trends into rules for how big to trade, when to enter, where to put stops, and how much it costs. It avoids treating trends as sure things.
Quick Answer: Economic indicators shape forex trends by showing where actual data on growth, inflation, and jobs differ from expectations. These differences influence interest rate outlooks and currency values, alongside local factors like gold prices and Reserve Bank policies. We use these indicators to guide conditional trading decisions—not as automatic buy or sell triggers.
What Are Economic Indicators in Forex Trading?
Economic indicators show how well an economy is doing. They give clues about growth, inflation, jobs, policies, and trade. Forex traders use these indicators as facts to understand market expectations, not as predictions.
Before reacting to a report, ask: What changed? Was the result better or worse than expected? Could it affect views on interest rates?
Types of indicators
Economic indicators are of three types:
- Leading indicators suggest what might happen next, such as business surveys and consumer confidence.
- Coincident indicators show how things are now, like jobs and retail sales.
- Lagging indicators confirm what has already happened, like some inflation and jobs data.
Main groups and what they mean for forex
| Indicator group | Examples | What it shows | Forex impact | Limitations |
|---|---|---|---|---|
| Inflation | CPI, PPI | Changes in prices consumers and producers pay | Can affect expectations for interest rates | One report might only show short-term changes |
| Growth | GDP, retail sales | Amount of output and spending | Strong growth can raise demand for currency | Data might be updated later |
| Employment | Payrolls, unemployment | Health of the job market | Strong jobs data may raise interest rates | Monthly numbers can vary widely |
| Interest rates | Central bank choices and statements | Direction and cost of borrowing | Affects currency yield differences | Markets often predict moves early |
| Trade | Current account, trade balance | Trade between countries | Influences long-term currency demand | Commodity prices can skew data |
Remember, the economic calendar is just a tool to start your analysis. It is not a final answer. Always compare results to forecasts, plan for different outcomes, and keep a trading journal to track data well.
Why Economic Indicators Matter for South African Forex Traders
Not all currency pairs react the same way to economic news. For USD/ZAR traders, the Rand’s special sensitivities add extra layers beyond patterns on charts.
Think about how local factors like South African growth, gold and platinum prices, global risk moods, and US rate expectations all combine to affect USD/ZAR moves.
For example, a strong US retail sales report might push up Federal Reserve rate expectations. This can raise Treasury yields and strengthen the dollar. That can push USD/ZAR higher.
But the Rand’s reaction also depends on other things. South African Reserve Bank decisions and commodity price changes can either counter or magnify those moves.
Because USD/ZAR is very volatile, traders need to manage margin carefully. They must watch for spreads getting wider and expect slippage during big news.
Before you trade, follow clear rules:
- Exposure: Make your positions smaller if volatility is higher than what your strategy handles.
- Execution: Watch live spreads and skip trades when costs jump.
- Risk: Know that stop orders might not fill well in fast markets.
- Review: Keep a thorough journal of forecasts, trade entries, and fills.
In the end, macro analysis only helps if it leads to a clear trading rule. Otherwise, it is just talk.
How Economic Indicators Drive Forex Market Trends
A strong economic release does not automatically strengthen its currency. The market first compares the reported figure with the forecast, then reprices future central-bank policy and expected returns.
Imagine U.S. inflation comes in higher than expected.
Traders might expect interest rates to stay high longer. This can raise Treasury yields and boost demand for dollars.
But if this was already expected, USD/ZAR may not move much or could move opposite.
Here is the chain of events:
Data surprise: The real result is different from what most expected.
Policy expectations: Traders change their views on interest rates and future guidance.
Currency demand: Money moves to the currency with better expected returns, causing price changes.
Differences in interest rates often drive the bigger trend.
If the gap between U.S. and South African rates grows, it can support the dollar. If South African rates are expected to rise, the Rand may get stronger.
What central banks say is important because future guidance can move prices before any actual rate changes.
For USD/ZAR, this trend also depends on gold, commodity flows, global risk appetite, and local policies.
A weaker dollar might not help the Rand if lower gold prices or political risks make people want dollars more.
The first price move can be misleading.
USD/ZAR often has bigger daily swings and wider spreads than major pairs. Typical ECN spreads are about 15–30 pips.
Low liquidity can trigger stop orders, and crowded trades may cause sharp reversals.
A good rule is to lower your position size before big news, check live spreads, and avoid setting stops where normal moves can hit them.
Write down the forecast, results, spread, slippage, and your trade details in a journal.
This helps tell real trends from short news spikes.
Examples and Misconceptions in Forex Market Analysis
Economic indicators trigger a sequence of events; they don’t tell you to buy or sell immediately.
USD/ZAR typically moves 300 to 500 pips each day, underscoring the need for scenario planning and disciplined risk management.
Here’s how different reports can steer trades:
| Market Condition | Report Result | Likely Policy View | Possible Currency Move | Safer Trader Action |
|---|---|---|---|---|
| Inflation above forecast | CPI at 3.7% vs 3.4% | Rates may stay high; yields rise | USD could strengthen; USD/ZAR depends on risk sentiment | Wait for spreads to settle before trading |
| Inflation as expected | CPI at 3.4% | Rates stable | Small or corrective price moves | Avoid trading solely on release |
| Inflation below forecast | CPI at 3.1% | Rate cuts possible | USD might weaken; USD/ZAR could fall if Rand is favored | Reduce trade size; set clear exits |
| Conflicting data | Lower inflation, higher GDP | Policy unclear | Could trigger volatile or whipsaw moves | Stay out or stick to tested rules |
Backtests that ignore spreads, slippage, or market shifts can mislead.
Keep a detailed trading journal tracking your forecasts, trades, and execution to evaluate indicator effectiveness.
Applying Economic Indicators Without Losing Trading Discipline
Economic indicators should help you plan different outcomes and manage risk. They should not force automatic trades.
For example, U.S. inflation may support the dollar, but if spreads widen, slippage rises, or gold prices change fast, trading USD/ZAR may be too risky.
| Timing | Trader Action | Decision Question | Risk Control |
|---|---|---|---|
| Days before release | Record the forecast, past data, affected currencies, likely policy impact. | Which outcomes would alter your plan? | Set maximum exposure before trading. |
| One hour before release | Check calendar, USD/ZAR spreads, margin, and broker updates. | Are trading costs acceptable? | Review spreads and broker conditions. |
| Immediately after release | Compare actual data with forecasts, watch yields and currency demand. | Does the initial move seem reasonable? | Avoid market orders in volatile conditions. |
| When liquidity returns | Assess spreads, slippage, and price movement. | Does your plan still hold? | Reduce position or stay out if costs remain high. |
| End-of-day review | Log release details, trade entries, stops, fills, spreads, slippage, and results. | Did your rules work or did emotions drive decisions? | Update your journal; discard unsupported ideas. |
Cut your position size if stop distances or spreads grow. Don’t widen stops just to keep the same lot size.
Limit orders control the price but might not fill. Market orders make sure you trade but risk slippage.
Check broker comparison criteria for regulation, spreads, ZAR deposits, and withdrawals. Always confirm your broker’s current terms.
Geopolitical shocks can change normal data patterns through oil, gold, risk mood, and emergency policies.
When this happens, pause trading, lower your risk, and wait for stable markets before relying on economic reports.
What are the top 3 forex indicators?
The top 3 forex indicators are commonly considered to be economic indicators related to growth, inflation, and employment. These indicators influence interest rate expectations and currency valuations, making them crucial for informed trading decisions.
What is the best trading strategy in 2026?
The best trading strategy in 2026 involves using economic indicators for scenario planning and risk management rather than relying on automatic buy or sell signals. Traders should analyze differences between forecasted and actual data and consider broader factors like interest rates and commodity prices before entering trades.
What is the 3-5-7 rule in forex?
The 3-5-7 rule in forex is not specified in the given content. Therefore, no detailed information on this rule is available from the provided article.
Is forex trading profitable in 2026?
Forex trading may be profitable in 2026 if traders apply disciplined risk management and interpret economic indicator surprises correctly. Profitability depends on assessing market conditions, managing spreads and slippage, and aligning trades with evolving policy expectations.
How much is $1 USD in ZAR today?
The article does not provide the exact current exchange rate for $1 USD in ZAR. However, USD/ZAR volatility can see daily moves of 300 to 500 pips influenced by U.S. and South African economic factors.
Turn Indicator News Into a Trading Decision
Economic indicators are most important when they differ from what was expected.
For a Gauteng trader watching USD/ZAR in London hours, stronger US inflation can cause a quick jump. But this first spike may not last.
Sound forex market analysis asks what the data changed, whether markets had already priced it in, and how much ZAR exposure the account can safely carry.
Treat each report as a scenario, not a guess. Define the expected response, the point where it becomes wrong, and the risk before trading.
Today, open the economic calendar and pick one upcoming report.
Write down the forecast, two possible outcomes, and your maximum loss. Wait for spreads and prices to calm down before deciding if the market trend fits your trade.