


Two weeks of quiet consolidation followed by a 150‑pip swing in an hour — that jolt feels familiar to traders who woke to surprise central bank moves in 2025. Those shocks are symptoms of deeper shifts: **interest‑rate divergence** between major economies, fractured **global liquidity** patterns, and policy signalling that no longer follows old calendars.
Volatility is not the only change. Market internals now reflect **AI‑driven order flow**, faster offshore capital shifts, and commodity cycles that amplify currency pairs in unexpected ways. Those forces turn yesterday’s reliable mean‑reversion setups into traps and make momentum strategies either brilliant or brutal.
Adapting doesn’t mean reinventing everything; it means recalibrating risk, narrowing timeframes when correlations break down, and choosing indicators that respond to regime shifts. Traders who treat strategy as fluid — not sacred — will navigate 2026’s landscape with far fewer surprises.
Understand the 2025 Macro Backdrop and Its Forex Implications
Global macro in 2025 will still be dominated by divergent central-bank paths, sticky post-pandemic inflation in pockets, and recurring geopolitical shocks. That mix drives bigger, faster currency moves than in a low-vol environment — which matters because forex trades priced on small rate and volatility edges can suddenly swing into trend or reversal phases. Watch rate differentials, inflation surprises, and geopolitical headlines first; they set whether a pair is a *carry* candidate, a *flight-to-safety* play, or a volatility breakout.
What to watch right now
* **Rate differentials:** Central banks that tighten faster push currencies higher via yield-seeking flows and tighter domestic money markets.
* **Inflation surprises:** Upside surprises accelerate currency momentum; downside surprises weaken inflation-linked carry strategies.
* **Geopolitics:** Conflicts and sanctions create sudden safe-haven demand for USD/CHF/JPY and widening risk premia in EMFX.
* **Liquidity squeezes:** End-of-quarter or unexpected funding stress amplifies moves and widens spreads.
* **Fiscal policy shifts:** Large deficits or stimulus change inflation expectations and long-term rate curves.
### Side-by-side comparison of macro drivers and their typical short-term vs medium-term impact on forex
| **Macro driver** | Short-term market effect | Medium-term market effect | Trading implication |
|—|—|—|—|
| Interest rate shocks | Sharp repricing, yield-sensitive pairs gap | Trend established around new rate trajectory | Favor momentum trades on clear differential; tighten stops |
| Inflation surprises | Volatility spike, inflation-linked assets reprice | Persistently higher/lower inflation shifts policy path | Use inflation breakevens + CPI beats for directional entries |
| Geopolitical crises | Safe-haven flows, risk-off across EM and commodities | Structural capital relocation, policy responses linger | Prefer liquidity-rich pairs; reduce position size in thin FX |
| Liquidity squeezes | Wider spreads, slippage, forced deleveraging | Market structure changes if recurring | Trade smaller size; confirm liquidity before entering |
| Fiscal policy shifts | Repricing of curves and FX forward points | Affects currency through growth and financing needs | Use forward curves to hedge or exploit carry mispricings |
Industry analysis shows these drivers rarely act alone; they interact and compound. For example, an inflation surprise that forces a central bank to hike while geopolitical risk rises creates a perfect storm for asymmetric FX moves.
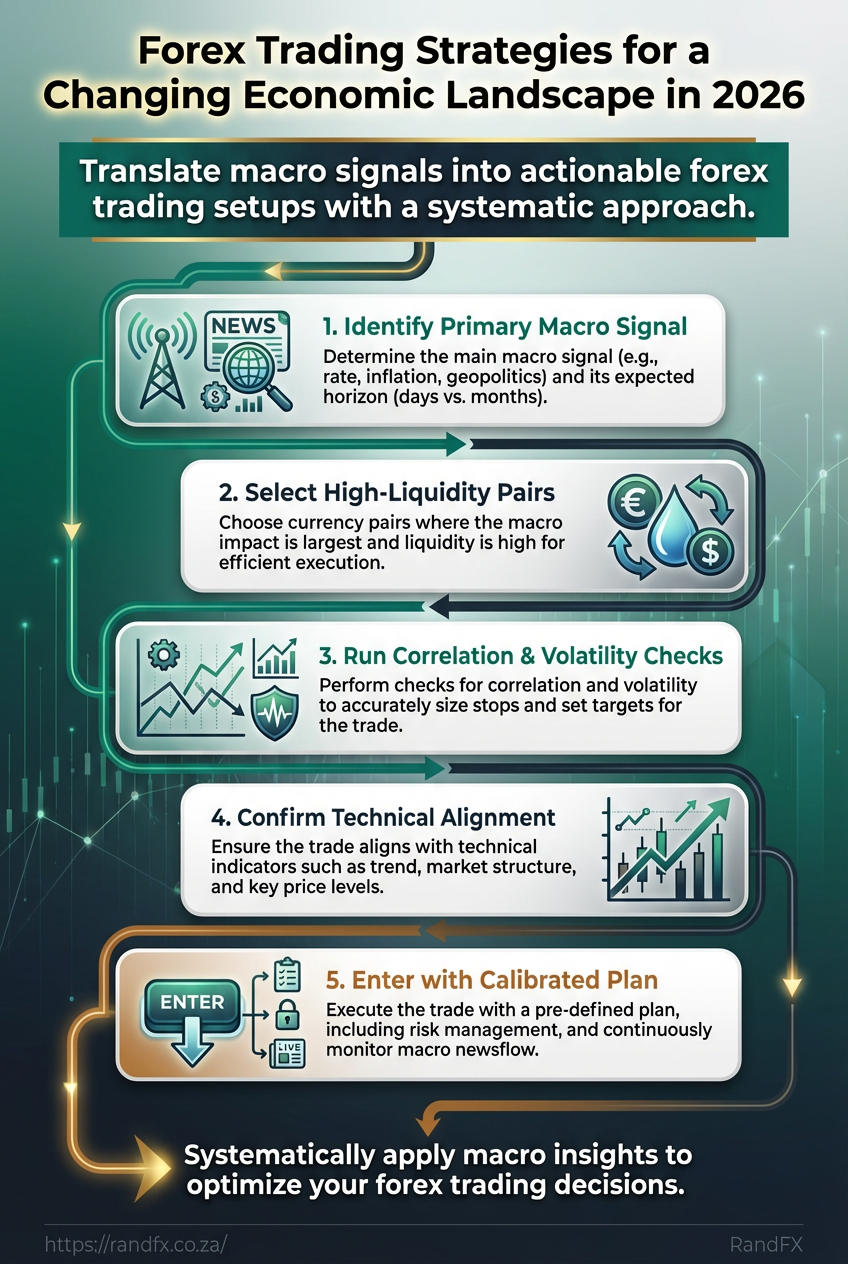
Translating macro signals into tradeable setups
1. Identify the primary macro signal and expected horizon (days vs months).
2. Select pairs where the macro delta is largest and liquidity is high.
3. Run correlation and volatility checks to size stops and targets.
4. Confirm technical alignment (trend, structure, key levels).
5. Enter with a calibrated plan and monitor macro newsflow.
*Checklist:*
**Confirm macro:** Rate/inflation/geopolitics points to direction.
**Technical alignment:** Break or retest on higher timeframe.
**Liquidity:** Adequate ADV and tight spreads.
**Risk:** Stop, position size, and contingency for headline shocks.
When choosing an execution venue, compare brokers on spreads and liquidity; the [Compare forex brokers](https://randfx.co.za/brokers/broker-comparison/) tool helps shortlist platforms with tight execution. For retail-facing options, market leaders like [XM](https://clicks.pipaffiliates.com/c?c=487256&l=en&p=1) and [HFM ](https://www.hfm.com/int/en/?refid=192941) often offer competitive pricing and local support.
Understanding the macro backdrop makes trade selection less random — it converts news into a disciplined workflow that respects liquidity, correlation, and risk. Keep that discipline and the macro edge becomes a repeatable source of alpha.
Adaptive Strategy #1: Volatility-Based Approaches for Choppy Markets
When markets refuse to trend cleanly, the most reliable edge is adapting entry, sizing, and protection to measured volatility rather than forcing directional bias. Short-term volatility breakouts and scalping focus on micro-moves around expanding volatility; hedged option and range strategies buy protection when directional conviction is low. Both approaches trade certainty for controlled risk and repeatability.
Short-term volatility breakouts and scalping
* **Filter with ATR:** Use `ATR(14)` or session-specific ATR to define what counts as a real breakout — price movement below `0.5×ATR` is noise, above `1.0–1.5×ATR` suggests tradable momentum.
* **Confirm with volume:** Require above-average tick or volume bars for breakout validity; low volume false-breaks are common in choppy sessions.
* **Observe session context:** London open and US open have distinct volatility profiles; bias scalps to session ramps.
* **Timeframe and target-setting:** Trade on 1–5 minute charts for execution, set micro-targets at `0.25–0.75×ATR` and larger targets at `1.0–1.5×ATR`.
* **Aggressive, risk-managed sizing:** Size aggressively but cap per-trade risk (example: risk 0.25–0.5% of equity per scalp), use tight `stop-loss = 0.5×ATR` and scale out quickly.
1. Identify a volatility uptick (ATR rising for 3 consecutive bars).
2. Verify volume above the 20-period session average.
3. Enter on a retest or on momentum candle close; place stop at `0.5×ATR`.
4. Scale out at `0.5×ATR` and `1.0×ATR`; trail remaining with `0.5×ATR` ATR-based stop.
Hedged option and range strategies for uncertain trends
* **Use collars when you want downside protection with limited cost.** Collars pair a protective put with a financed call sale to reduce premium outlay.
* **Use long straddles when large, direction-agnostic moves are possible.** Straddles profit from big moves but carry high theta decay.
* **Weigh costs vs protection:** Collars lower net premium but cap upside; straddles maximize upside/potential but require bigger move to breakeven.
* **Manage theta and gamma:** Hedge short-dated gamma with dynamic delta adjustments; favour longer-dated protection when theta bleed is unacceptable.
**Collar:** Buy a protective put and sell a call to finance protection; best for preserving position with minimal net premium.
**Long straddle:** Buy a call and put at the same strike; best when expecting large move and direction uncertain.
**Short strangle (range):** Sell OTM call and put to collect premium; best in range-bound markets but requires active risk limits.
**Synthetic hedge via spot and options:** Combine spot position with offsetting option deltas to mimic collars or reduce exposure while keeping upside.
### Hedging instruments/approaches and their pros/cons for 2025 market conditions
| Hedge type | Best use case | Pros | Cons |
|—|—|—|—|
| **Vanilla collar** | Protect existing spot position with low cost | **Lower premium**, preserves some upside | Caps upside, requires adjustments |
| **Long straddle** | Anticipating large move without directional bias | Unlimited upside, symmetric payoff | **High theta decay**, expensive upfront |
| **Short strangle (range)** | Income in clearly range-bound markets | Collects premium, boosts yield | Large tail risk, margin intensive |
| **Synthetic hedge via spot and options** | Fine-tune delta exposure without closing spot | Flexible, can be cheaper than outright options | Complexity in management, transaction costs |
Collars fit conservative protection needs with limited cost, straddles suit event-driven volatility bets, short strangles monetize calm markets at the expense of tail risk, and synthetics let experienced traders tune exposure while keeping capital at work.
Adaptive execution and tidy sizing make volatility strategies repeatable. For scalpers, measure everything to ATR and volume rules; for hedged options, choose structures that match the trader’s capital, time horizon, and willingness to pay theta. Keeping these mechanics tidy is what turns choppy markets from a problem into a consistent opportunity.
[Compare forex brokers](https://randfx.co.za/brokers/broker-comparison/) for platforms and options chains that support rapid execution and option access.
Adaptive Strategy #2: Macro Momentum and Carry in a Rate-Driven Regime
Building a carry-momentum hybrid works best when macro fundamentals (rate differentials) line up with directional price momentum. Start by screening for currencies where the yield advantage is real and durable, then add momentum confirmation to avoid funding high-yield pairs that are rolling over. The approach blends *income capture* with *trend-following discipline* so positions collect carry while odds are tilted in the trader’s favor that the exchange rate won’t erase the yield through depreciation.
**Screening criteria for carry candidates**
**Yield differential:** Look for pairs with a sustained positive differential versus the funding currency (typically ≥ 2%-3% annualised).
**Liquidity:** Choose pairs with tight spreads and deep order books to keep carry erosion low.
**Macro stability:** Prioritize economies with clear rate paths and credible central bank communication.
**Momentum confirmation signals**
**Moving averages:** Use a 50/200 EMA crossover for medium-term confirmation; require price above the 200 EMA for long carry holds.
**MACD:** Look for MACD histogram turning positive and rising momentum; avoid entering on divergence.
**Trend filters:** Require higher highs/higher lows on the daily chart or a positive ATR-adjusted trend score.
**Interest-rate expectation management**
**Forward rates and swaps:** Monitor the short-term interest rate forward curve and `OIS` swaps for where markets price policy.
**Central bank guidance:** Trade only when at least one credible data point (inflation beat/miss, policy statement) supports the rate view.
### Popular currency pairs for carry-momentum suitability in 2025 (yield, volatility, liquidity, trend score)
| Currency pair | Typical yield differential | Volatility (30d) | Trend suitability |
|—|—:|—:|—|
| **AUD/JPY** | 3.0% – 4.0% | 7% – 10% | Strong |
| **NZD/JPY** | 3.5% – 4.5% | 8% – 11% | Strong |
| **USD/ZAR** | 8% – 12% | 15% – 22% | Moderate |
| **EUR/CHF** | 0% – 0.5% | 3% – 6% | Weak |
| **GBP/USD** | 1.5% – 3.0% | 6% – 9% | Moderate |
*Key insight: High-yield crosses like AUD/JPY and NZD/JPY combine respectable carry with tradable trendiness, while USD/ZAR offers large yield at the cost of volatility and political tail risk. Low-yield pairs (EUR/CHF) rarely fit a carry-momentum play.*
When to exit or hedge carry positions
1.
Set a **rate-surprise threshold**: if market-implied policy moves shift by >50–75 bps in 1–3 months from your entry expectation, reassess or reduce size.
2.
Monitor **volatility and correlation**: a sharp rise in 30‑day realized vol or a rising correlation of your pair to risk assets signals faster unwinds; trim exposure.
3.
Apply practical hedging overlays: implement a short-dated FX option collar, size with `delta` hedges to cap downside while preserving carry; or use forward contracts to lock in part of the yield if downside risks spike.
A disciplined hybrid combines clear screening with objective momentum rules and explicit triggers to hedge or exit. That structure keeps carry as the performance engine while momentum provides directional protection — a sensible pairing for rate-driven markets.
Adaptive Strategy #3: Data-Driven Systematic Approaches
Systematic approaches trade rules instead of hunches: simple, repeatable models for mean-reversion and breakouts combined with regime detection and risk-parity overlays create a robust engine that adapts when market behaviour changes. These systems force discipline on parameter choices, make stress-testing straightforward, and let risk controls operate at the portfolio level rather than per-trade emotion. Practical implementations use small, transparent rule-sets that are easy to backtest and quick to audit when performance diverges.
**Mean-reversion vs breakout basics**
**Mean-reversion:** A strategy that assumes price will revert to a short-to-medium term average.
**Breakout:** A strategy that assumes directional moves past a volatility range will continue.
Mean-reversion and breakout systems are complementary: mean-reversion profits from calm, mean-reverting markets while breakouts capture trending regimes. A sensible systematic approach runs both in parallel with a regime detector deciding capital allocation.
### Simple model design and parameter sensitivity
**Parameter choices matter**
* **Lookback window:** Short windows (10–20 bars) increase responsiveness but inflate noise; long windows (50–200 bars) smooth signals but lag.
* **Thresholds / multipliers:** Use z-score or ATR multiples for entries; thresholds of ±1.0–1.5 z for mean-reversion and 1.5–3.0 ATR for breakout are common starting points.
* **Hold time / exit rules:** Time-based exits (5–20 bars), stop-loss at 1–3 ATR, and profit targets based on risk multiple (2–4x) keep the P/L profile predictable.
*Sensitivity testing:* Run parameter sweeps and show performance surfaces. If small parameter tweaks flip Sharpe or max drawdown dramatically, the strategy is brittle.
### Walkthrough: entry and exit rules 1. Define universe and timeframe.
2. Calculate `20`-bar moving average and `20`-bar standard deviation (`std`).
3. Mean-reversion entry: buy when price < MA - 1.25*std; short when price > MA + 1.25*std.
4. Mean-reversion exit: exit at MA or set stop at 2*ATR.
5. Breakout entry: buy on close above highest high of `n=20` bars + 1.5*ATR; short on close below lowest low – 1.5*ATR.
6. Breakout exit: trailing stop at 1.5*ATR or fixed time-exit after `n` bars.
Backtests should separate in-sample tuning from out-of-sample evaluation to avoid overfitting.
### Backtest minimums and common pitfalls
**Backtest minimums**
* **Sample length:** At least 3–5 years for FX majors; longer if using lower liquidity pairs.
* **Walk-forward:** Use rolling walk-forward validation with re-optimization windows (e.g., 6m train / 3m test).
* **Transaction costs:** Include realistic spreads, slippage, and commission.
**Pitfalls to avoid**
* **Overfitting:** Excessive parameter optimization without out-of-sample validation.
* **Survivorship bias:** Using only currently listed pairs masks real historical slippage.
* **Ignoring execution:** Trades that look good on tickless data can vanish after spreads and latency.
> Market regimes shift; systems that ignore regime often show attractive in-sample metrics but poor forward performance.
### Regime detection and risk-parity overlays
**Regime detection methods**
**Volatility regime:** Use realized volatility (e.g., 20-day annualized) crossing historical quartiles.
**Trend regime:** Use ADX or Hurst exponent to tag trending vs mean-reverting periods.
Detect regimes with simple, fast signals so allocation can flip within days rather than weeks.
**Allocation rules per regime**
* **High-volatility trending:** **Increase breakout allocation** and **reduce mean-reversion**; raise stop distances to avoid noise stops.
* **Low-volatility mean-reverting:** **Increase mean-reversion allocation** and **reduce breakout**; tighten stops and shorten holding periods.
* **Transitional/uncertain:** Split capital evenly or move to reduced exposure and cash-like instruments.
**Portfolio-level risk controls**
* **Risk-parity overlay:** Scale each strategy’s allocation so each contributes equally to portfolio volatility (target e.g., 3% annualized vol per leg).
* **Maximum drawdown cap:** Stop adding new positions if portfolio drawdown > X% (common caps 6–10%).
* **Position-size floors:** Minimum and maximum per-instrument exposure to prevent crowding.
### Practical implementation checklist
* **Data hygiene:** Clean ticks, fill missing bars conservatively.
* **Robust backtests:** Walk-forward, out-of-sample, realistic costs.
* **Monitoring:** Track per-strategy vol contribution and regime-tag frequency daily.
* **Broker choice:** Use brokers with tight execution and transparent costs; see [Compare forex brokers](https://randfx.co.za/brokers/broker-comparison/) for options.
### Recommended backtest metrics and thresholds to evaluate system robustness
### Recommended backtest metrics and thresholds to evaluate system robustness
| Metric | Recommended threshold | Why it matters | Action if below threshold |
|—|—:|—|—|
| **Sharpe ratio** | ≥ 0.8 (annualized) | Measures risk-adjusted return; flags poor reward per unit risk | Reduce leverage, revisit signal quality, or drop strategy |
| **Max drawdown** | ≤ 20% (strategy-level) | Shows peak capital stress; large drawdowns destroy compounding | Tighten stops, lower position sizes, add hedges |
| **Win rate** | 35–60% | Indicates trade balance; low win rate OK if profit factor high | Check reward-to-risk; adjust profit targets or stop rules |
| **Profit factor** | ≥ 1.5 | Gross profits divided by gross losses; robust >1.5 | Improve signal filtering or exclude low-quality pairs |
| **Out-of-sample performance** | ≥ 70% of in-sample metric | Tests generalizability; major decay signals overfitting | Simplify model, increase regularization, extend walk-forward |
*Key insight: These thresholds are practical guardrails — strategies failing multiple metrics usually need redesign rather than parameter tinkering.*
Running simple, explainable systematic models with quick regime detection and a risk-parity overlay yields a disciplined, adaptable engine for forex trading. When model rules are transparent and backtests realistic, changing allocations becomes a scaled response to what the market is actually doing rather than a reactive bet.
Practical Risk Management and Execution in 2025
Start with position size tied to volatility rather than a fixed percent of equity. Using volatility-adjusted sizing keeps exposure consistent when markets breathe differently, reduces surprise drawdowns, and makes stop placement meaningful.
**Volatility‑adjusted position‑sizing**
A common, practical rule is: position size = (Risk per trade in account currency) / (Stop distance in pips × pip value). Use `ATR` for the stop distance rather than a fixed pip amount so the same idea scales across instruments and regimes. Many traders set stop distance to `1.5 × ATR(14)` on their chosen timeframe, then size so that the dollar risk equals a fixed fraction (for example, 0.5–1% of equity).
### Stop placement and slippage control
Use ATR-based stops for dynamic spacing.
* **Entry context:** place the stop beyond a recent structure level plus `1.0–1.5 × ATR` to avoid noise.
* **Trailing stops:** update using lower-period ATR to capture momentum without early whipsaws.
* **Order types to limit slippage:** prefer `limit` or `stop-limit` when liquidity is thin; use `market` orders in high-liquidity conditions to guarantee fill but accept small slippage.
### Illustrate slippage impact and order choice across liquidity conditions
| Liquidity condition | Recommended order type | Expected slippage range | Execution tip |
|—|—|—|—|
| **High liquidity (London/New York session)** | Market / Limit depending on speed needs | 0–0.5 pips typical | Use market for immediacy; check depth to avoid hidden spread widening |
| **Low liquidity (Asian session)** | Limit / Stop‑limit | 0.5–2 pips typical | Use limit to control price; stagger entries to avoid partial fills |
| **Post‑news spike** | Stop‑limit / Avoid market at peak | 5–50+ pips possible | Prefer waiting or smaller size; use limit orders and scale in if necessary |
| **Illiquid exotic pairs** | Limit only | 10–100+ pips common | Reduce size dramatically; widen ATR multiple for stops |
*Key insight: slippage and order choice depend on session and instrument liquidity — in 2025 execution tools are better but market microstructure still dictates discipline.*
### Post‑trade processes and performance review
**Essential journal fields:**
**Setup:** Which setup triggered the trade and timeframe.
**Rationale:** Why the trade met strategy rules.
**Entry/Exit:** Exact orders, fills, and slippage recorded.
**Risk:** Position size, stop distance, and % of equity risked.
**Outcome:** Net P/L, R-multiple, and emotional notes.
Weekly KPI checklist:
1. Win rate (%) and sample size.
2. Average R per trade.
3. Expectancy = (Win rate × Avg win in R) − (Loss rate × Avg loss in R).
4. Max drawdown and equity curve slope.
5. Slippage average compared to target (pips).
Rules for changing rules vs noise: treat one-off misses or news-driven outliers as noise. Change rules only after a statistically meaningful sample (typically 50–100 trades) and when a repeatable edge erodes, not after emotional streaks.
For execution and broker choice, compare execution pages; consider [Compare forex brokers](https://randfx.co.za/brokers/broker-comparison/) as a starting point. Applying ATR sizing, disciplined order selection, and a tight post‑trade review loop keeps risk predictable and learning fast — that’s what separates surviving traders from thriving ones.
Tools, Brokers, and Practical Resources for 2025 Traders
Platform choice and broker selection decide whether a strategy is usable in live markets or stays an academic exercise. Prioritise execution quality, reliable market data, and a backtesting environment that mirrors live fills. For brokers, look beyond marketing — verify spreads, slippage behaviour, margin rules, and the exact execution model they use. Use demo accounts and short, funded tests before scaling capital.
* **Platform selection criteria:** execution latency, data fidelity, backtesting realism, API access, and options/derivatives availability.
* **Data tools to consider:** charting (order flow, footprint), screeners (volatility/volume filters), market data feeds (tick-level history), and research platforms for macro flows.
* **How to test a platform:** open a funded micro account, run the exact algo/strategy in forward mode for 30–90 trades, compare expected vs realized slippage, and validate round-trip latency.
### Platform features traders need for 2025 strategies (execution, backtesting, options access, API)
| Feature | Why it matters | What to test | Example providers |
|—|—|—|—|
| **Low-latency execution** | Reduces slippage for scalps and high-frequency rules | Measure round-trip time, order fill rates at peak hours | MetaTrader 5, cTrader, TradingView + broker bridges |
| **Backtesting engine** | Realistic results depend on tick-level simulation and slippage modeling | Replay tick data, run Monte Carlo and walk-forward tests | QuantConnect, NinjaTrader, TradingView (Pine for signals) |
| **Options trading access** | Adds hedging and income strategies to FX and equity systems | Check expiry coverage, Greeks, multi-leg order fills | Interactive Brokers, Saxo Bank, Deribit (crypto options) |
| **API / data export** | Enables automation, custom analytics, and reproducible research | Test `REST` endpoints, `FIX` connectivity, historical export formats | Alpaca, Interactive Brokers API, OANDA, QuantConnect |
platforms that combine low-latency order routing with robust historical tick data close the gap between backtest and live-trade performance. Balance usability (charts, screener) with programmatic access for scaling and auditability.
When narrowing brokers, run your shortlist through a simple checklist: spreads under realistic conditions, transparent margin rules, regulation in your jurisdiction, and a clear execution policy. Use [Compare forex brokers](https://randfx.co.za/brokers/broker-comparison/) as part of that due diligence, and consider direct trial trades with a small live stake before committing larger capital. Choosing the right stack shortens the path from idea to consistent P&L.
Conclusion
Markets in 2025 demand being both nimble and systematic: expect sudden central-bank shocks after quiet consolidation, favour volatility-aware entries over fixed-size bets, and let macro momentum guide carry decisions while disciplined risk controls limit drawdowns. The piece showed how a volatility-based stop strategy kept a trader whole during a surprise rate decision and how a simple momentum filter turned a whipsaw month into a small winning stretch—practical examples that reinforce the mix of rules and discretion worth adopting. If you’re wondering which approach fits your time frame, ask whether you need speed (volatility strategies), macro alignment (carry/momentum), or repeatability (data-driven systems); if risk management feels fuzzy, start by cutting position sizes and automating stop placement.
Before reallocating capital, **review your plan, backtest over the recent rate-regime shifts, and tighten execution rules**. For broker selection and live-testing, a practical next step is to compare execution costs, regulation and platform features — to streamline that research, use [Compare forex brokers in south africa](https://randfx.co.za/brokers/broker-comparison/). That link is one of several tools to help move from theory to live trades: pairing a robust strategy with the right broker and disciplined risk rules is what turns occasional insights into consistent performance.