


A perfect-looking breakout can fail in minutes.
Price snaps back, spreads widen, and the trade that looked obvious suddenly feels expensive.
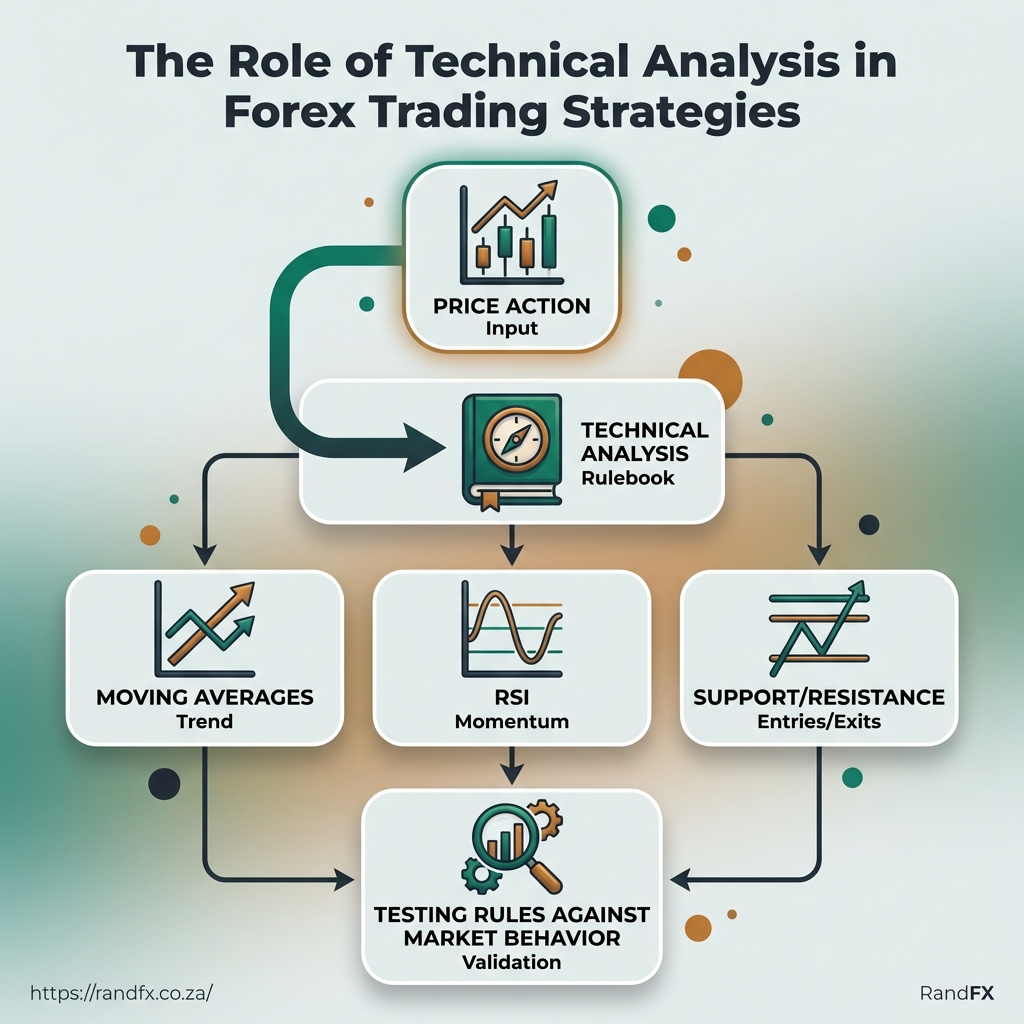
That is where technical analysis earns its place in forex trading.
It turns chart behavior into rules: trend, momentum, and support and resistance stop being vague ideas and start becoming entry and exit decisions.
The scale of the market matters too.
In April 2022, average daily global FX turnover reached $7.5 trillion, which is exactly why session timing, liquidity, and volatility can change how a chart setup behaves.
A signal that looks clean in a quiet market can act very differently when London and New York overlap.
Good forex strategies rarely depend on one indicator alone.
Traders often combine a higher-timeframe trend with lower-timeframe confirmation, then test those rules before risking real capital on live charts.
Tools such as MetaTrader 5 and TradingView make that process less guesswork and more repeatable testing, which is where TA becomes useful instead of decorative.
Even then, the chart is only part of the job.
Position size, stop placement, and the jump from backtest results to live execution can make or break the trade.
What is Technical Analysis and Why It Matters
A chart does not predict the market.
It shows how price has behaved, and that matters because FX trades on expectations as much as facts.
Technical analysis is the practice of reading price action, indicators, and chart patterns to make trading decisions.
The old-school version rests on three ideas: price already reflects known information, prices tend to move in trends, and repeating human behavior leaves patterns on the chart.
Timeframe changes the whole story.
A moving-average crossover on a 5-minute chart can be noise, while the same setup on a daily chart may point to a real trend.
That is why traders often use a higher timeframe for direction and a lower timeframe for entries.
In a market that averaged $7.5 trillion in daily turnover in April 2022, according to the BIS Triennial Central Bank Survey, that kind of structure helps cut through the noise.
- Price reflects information: The chart already carries the market’s reaction to news, expectations, and positioning.
- Trends persist: Once a move starts, traders often look for continuation rather than random zigzags.
- History leaves clues: Support, resistance, breakouts, and indicator signals are all ways of reading repeated behavior.
A simple example makes it clearer.
Imagine EUR/USD is trending higher on the daily chart, then pulls back to a moving average on the 1-hour chart.
A trader using technical analysis might wait for a bullish candle or momentum turn before entering, instead of guessing at the exact top or bottom.
Pros, cons, and when to rely on technical analysis
| Aspect | Technical Analysis | Fundamental Analysis | Recommended Use |
|---|---|---|---|
| Time Horizon | Works across intraday, swing, and longer-term charts. | Better for medium- to long-term moves tied to policy or growth. | Use TA for entries and exits; use FA for the bigger thesis. |
| Primary Objective | Read price behavior and trader sentiment. | Estimate value or macro direction. | Use TA when timing matters most. |
| Data Requirements | OHLC price data, indicators, levels, and sometimes volume. | Economic data, central-bank decisions, earnings, and news flow. | Use TA when you need fast, repeatable decisions. |
| Reaction to News | Can react immediately, but news can trigger whipsaws. | Updates the story after new information lands. | Pair TA with caution during major releases. |
| Use Case Example | Trade a pullback in a daily uptrend. | Hold a currency view based on rate expectations. | Blend both when you want structure and context. |
It gets shaky when news shock hits, when a backtest is too perfectly tuned, or when a trader bends the rules after the fact.
A good rule of thumb is simple.
Use technical analysis for entries, exits, and risk placement.
Lean on fundamentals when the trade depends on policy, growth, or a major macro shift.
Used well, technical analysis gives structure to a messy market.
That alone saves a lot of guesswork.
Key Tools & Indicators for Forex Traders
A clean forex chart can still lie to you.
That is why the useful tools are the ones that turn price into rules. Moving averages and MACD help with direction. RSI, ADX, Bollinger Bands, and plain old support and resistance help with timing, strength, and risk.
The market itself is big enough to punish sloppy setups.
As of April 2022, the BIS put average daily global FX turnover at $7.5 trillion, which is a good reminder that liquidity and volatility can change fast across sessions.
Quick reference for the core indicators
| Indicator | Purpose | Default Settings | Best Timeframes | Common Signals |
|---|---|---|---|---|
| SMA/EMA | Show trend direction and smooth noise | 20, 50, 200 periods; EMA reacts faster than SMA | H1, H4, Daily | Crossovers, pullback entries, trend filter |
| MACD | Measure momentum and trend shift | 12, 26, 9 | H1, H4, Daily | Signal-line cross, histogram fade, zero-line break |
| RSI | Measure momentum and overbought/oversold pressure | 14 periods; 70/30 levels | M15 to Daily | Divergence, 70/30 reversal zones, midline trend bias |
| ADX | Measure trend strength, not direction | 14 periods; 20/25 as strength guide | H1, H4, Daily | Rising ADX with trend, weak trend when below threshold |
| Bollinger Bands | Show volatility and price stretch | 20 periods, 2 standard deviations | M15 to Daily | Band touch, squeeze, breakout expansion |
A 20 EMA can help with pullback entries in an active trend, while a 200 SMA often works better as a broad trend filter.
MACD and RSI add timing, but they work best when the higher-timeframe trend already makes sense.
Trading the tools together
Support and resistance still matter because markets remember crowded price zones.
Draw them from obvious swing highs and lows, then check whether moving averages or Fibonacci levels cluster nearby.
That cluster is often more useful than any single line on the chart.
A simple filter keeps things cleaner.
- Mark the trend first: Use a 50 or 200 moving average on H4 or Daily.
- Check momentum next: MACD should support the move, and RSI should not fight it.
- Measure volatility: Bollinger Bands help show whether price is squeezing or expanding.
- Place levels carefully: Use support, resistance, and Fibonacci only where price has reacted before.
- Set risk from the chart: Wider bands usually mean wider stops and smaller position size.
Bollinger Bands are especially handy when price compresses before a breakout.
That squeeze often comes before a sharp move, but only if the level lines up with a real chart zone.
The best setups usually come from confluence, not from one magic indicator.
When trend, momentum, volatility, and levels all point the same way, the chart gets a lot easier to trust.
Constructing Robust Technical Trading Strategies
What if the strongest trading strategy is the one that looks a little boring on paper?
That is usually the one built around clear rules, a fixed timeframe, and disciplined risk.
In forex, where the market handled about $7.5 trillion in average daily turnover in April 2022, liquidity and volatility shift fast, so vague ideas fall apart quickly.
Start by defining the trade’s job.
Are you trying to catch a trend, fade an overreaction, or hold for a session move? Then choose the tools that match that job, not the other way around.
- Define the market context. Pick one timeframe for the setup and one for confirmation. A clean mix is
H4for direction andM15for entries.
- Set the rules before the trade. Decide what counts as a valid signal, where the stop goes, and when profit gets taken. If the rules need a mood swing to work, they are not rules.
- Fix the risk first. Keep risk per trade small and consistent, then size the position from the stop distance. The trade should fit the account, not the other way around.
Two strategy blueprints that actually hold up
| Aspect | Trend-Following Strategy | Mean-Reversion Strategy | When to Use |
|---|---|---|---|
| Timeframe | H4 direction, M15 entry timing |
M15 or H1 around stretched moves |
Trend days versus range days |
| Indicators | Higher-timeframe moving average, breakout level, pullback confirmation | RSI-like exhaustion reading, range boundary, failed breakout | When price keeps rejecting a zone |
| Entry Rule | Trade after price breaks and retests in trend direction | Trade after price tags an extreme and shows reversal confirmation | After a clean continuation or sharp overshoot |
| Stop/Target | Stop beyond the retest swing; target at 2R or trail behind structure |
Stop outside the recent extreme; target at the mid-range or 1.5R |
When the setup needs room versus speed |
| Risk per Trade | Usually smaller, because losses can stack during chop | Also small, because reversals can fail hard | Any live account, always fixed risk |
| Win-Rate Assumptions | Often lower, but payoff can be larger | Often higher, but average win is smaller | Depends on market regime and execution |
Trend systems usually win less often, but the good trades travel farther.
Mean-reversion setups can look prettier in backtests, yet they get punished when a strong trend ignores the range.
Trend-following blueprint
A strong trend setup starts when the higher timeframe is already pointing one way.
The entry comes from a pullback or a breakout retest, not from guessing the top or bottom.
- Direction: Use the higher timeframe to define trend direction.
- Trigger: Wait for price to break a clean level and retest it.
- Entry: Enter only after the retest holds and momentum returns.
- Stop: Place the stop beyond the swing that invalidates the retest.
- Target: Aim for
2R, then trail if momentum stays clean.
Imagine EUR/USD breaking above a prior session high, retesting it, and holding.
The trade is not about prediction; it is about letting price prove strength first.
Mean-reversion blueprint
This one works best when price stretches too far, too fast, then snaps back inside a range.
The trick is to demand proof that the move is tiring out.
- Context: Mark the range or obvious overextended zone.
- Trigger: Wait for exhaustion, then a rejection candle or failed push.
- Entry: Enter on the first confirmation back inside the range.
- Stop: Put the stop just beyond the extreme.
- Target: Take profit near the range midpoint or opposite edge.
Consider a pair that spikes into a daily resistance area, then loses momentum on the lower timeframe.
The short trade is valid only if the market actually starts turning, not just pausing.
Backtests on platforms such as MT5 or TradingView are useful here, but live execution still matters more than pretty equity curves.
If spread, slippage, or broker conditions change too much, even a decent system can get messy, so broker conditions deserve a quiet look through resources like Compare forex brokers.
A solid strategy does not need to be clever.
It needs to be specific, repeatable, and hard to break when the market gets noisy.
Risk Management, Position Sizing and Trading Psychology
What if the difference between a good setup and a bad month is not the entry at all, but the size of the trade behind it?
That is usually where traders get hurt.
A decent signal can survive a noisy chart, but it cannot survive oversized risk.
With average daily FX turnover at $7.5 trillion in April 2022, the market moves fast when conditions shift.
That makes position sizing, stop placement, and emotional control part of the strategy, not afterthoughts.
Sizing the trade before touching the button
A clean way to size a forex trade is to cap risk first, then work backward from the stop.
On major pairs, a simple formula looks like this:
Position size = Risk amount ÷ (Stop distance in pips × Pip value per standard lot)
For many USD-quoted majors, pip value is about $10 per standard lot.
That is why ATR-based stops matter so much.
If the chart says volatility is wider today, the position should get smaller, not forced to fit the same old size.
Position sizing examples with ATR-based stops
| Account Balance | Risk % | Risk Amount | ATR Stop (pips) Example | Calculated Lot Size |
|---|---|---|---|---|
| $500 | 0.5% | $2.50 | 20 | 0.01 |
| $500 | 1% | $5.00 | 25 | 0.02 |
| $500 | 2% | $10.00 | 40 | 0.03 |
| $5,000 | 0.5% | $25.00 | 20 | 0.13 |
| $5,000 | 1% | $50.00 | 25 | 0.20 |
| $5,000 | 2% | $100.00 | 40 | 0.25 |
| $50,000 | 0.5% | $250.00 | 20 | 1.25 |
| $50,000 | 1% | $500.00 | 25 | 2.00 |
| $50,000 | 2% | $1,000.00 | 40 | 2.50 |
In real trading, spreads, margin rules, and pair type can shift the final size, so a broker comparison like compare forex brokers is worth checking before you build a live plan.
Keeping your head in the trade
Psychology usually breaks down in three places: revenge trading, moving stops, and taking random entries after a loss.
MT5, TradingView, and cTrader can test a ruleset, but they cannot stop a trader from ignoring it.
A few rules make discipline much easier.
- Set a daily loss cap: Stop trading after a fixed drawdown, such as 2R or 3R.
- Pre-write the exit: Decide the stop before entry, then leave it alone.
- Journal the emotion: Record whether the trade was calm, rushed, angry, or bored.
- Review execution, not just P/L: Good losses still count as good trades.
- Trade one clean setup: No piling on because the chart feels “close enough.”
Journaling works best when it is blunt.
Note the setup, ATR, spread, entry reason, and whether the trade followed the plan.
After a few weeks, the pattern is usually obvious: the account does not die from one bad idea, it dies from repeated small rule breaks.
That is why risk control matters more than prediction.
A trader who protects capital gets to stay in the game long enough to improve.
Backtesting, Walk-Forward Testing and Optimization
What if a strategy looks brilliant until the first live week?
That usually means the test was too clean, too short, or tuned to one market mood.
Backtesting only earns trust when it includes the ugly parts: spreads, commissions, realistic fills, and enough trades to show whether the edge survives noise.
That matters in FX more than people like to admit, especially with average daily global turnover at $7.5 trillion in April 2022.
Big market, yes.
Clean fills, not always.
Practical backtesting metrics
| Metric | Definition | Recommended Threshold | Why it matters |
|---|---|---|---|
| Net Profit | Total gain after all trading costs | Positive in sample and out of sample | Tells you whether the system actually makes money after friction |
| Max Drawdown | Largest peak-to-trough equity drop | Preferably under 20%; 10–15% is cleaner for retail systems | Shows how much pain the account must survive |
| Sharpe Ratio | Return per unit of volatility | Above 1.0 is workable; 1.5+ is stronger | Helps separate steady edges from lucky bursts |
| Expectancy | Average profit per trade, often measured in R |
Must be positive; around 0.2R per trade is a solid practical target | Shows whether each trade has value over time |
| Win Rate | Share of winning trades | No fixed target; 40–60% can be fine if payoff is strong | Prevents chasing high hit rates with weak trade quality |
Expectancy and drawdown usually tell the better story.
For sample size, fewer than 100 trades is thin evidence, and 200+ trades across different market conditions is far more believable.
Avoiding overfitting
Overfitting is what happens when a system gets too friendly with past data.
It starts memorizing quirks instead of learning a repeatable edge.
The warning signs are easy to spot.
Tiny parameter changes wreck the results, the equity curve looks suspiciously smooth, or the strategy only works on one pair and one period.
MT5’s Strategy Tester and TradingView’s Pine Script are useful here because they force the rules into code instead of vague chart memory.
- Split the data: Use one period to build the idea and a later period to test it.
- Keep the rules lean: Fewer inputs usually age better than a pile of filters.
- Walk it forward: Re-test on the next untouched window before moving ahead again.
- Change one thing at a time: If three tweaks are needed to save the system, the edge is probably weak.
- Prefer small parameter ranges: A good system should not depend on one perfect setting.
Walk-forward testing is the reality check.
It shows whether the strategy can keep working as conditions change, which is the whole game in forex.
A clean backtest is nice; a strategy that survives the next batch of market data is the part that matters.
Implementation — Platforms, Execution and Broker Selection
What if the setup is solid, but the platform and broker quietly ruin the trade? That happens more often than people admit.
In FX, execution matters because the market is huge and fast.
The BIS reported average daily global turnover of $7.5 trillion in April 2022, so even small differences in spread, slippage, or fill quality can change real outcomes.
MT5 fits traders who want built-in testing and automation. TradingView works well when chart clarity and Pine Script rules matter most. cTrader is a strong choice for traders who want C#-based automation, while MT4 still hangs around for simpler chart workflows and older Expert Advisors.
- MT5: Best for systematic traders who want Strategy Tester support and newer tooling.
- TradingView: Best for visual chart work, alerts, and repeatable Pine Script strategies.
- cTrader: Best for traders who want cleaner order handling and C# automation.
- MT4: Best for basic discretionary trading and legacy EA setups.
Execution mechanics are the part many people skip.
Market orders can slip in fast moves, spreads widen when liquidity thins, and stop orders may fill worse than expected when price jumps through a level.
A simple chart can look perfect and still trade badly if the broker’s execution is slow or the spread is wide.
That is why fills matter more around session opens, news spikes, and quiet late-hours trading.
A practical setup checklist
- Pick one main platform: Use MT5, TradingView, or cTrader as your main screen, not three at once.
- Set clear alerts: Mark trend levels, session highs and lows, and breakout zones with price alerts.
- Match the chart to the trade plan: Use higher time frames for direction and lower ones for entry timing.
- Test order types: Try market, limit, and stop entries in a demo so you know how each behaves.
- Watch live spread behavior: Check how spreads move during London, New York, and quieter hours.
That setup gives you fewer surprises when a signal appears.
Broker selection checklist and partner options
The cleanest way to compare brokers is to line up regulation, spreads, platform support, and account fit in one place.
A side-by-side view on compare forex brokers makes that a lot easier than opening five tabs and hoping memory does the job.
| Broker | Regulation / Jurisdiction | Typical EUR/USD Spread | Platforms Supported | Why it might suit this trader |
|---|---|---|---|---|
| Exness | Multi-jurisdiction group; entities commonly include FCA, CySEC, FSCA, FSA Seychelles and others | From 0.0 pips on Raw/Zero-style accounts; standard accounts are wider | MT4, MT5, Exness Terminal, WebTerminal | Active traders who want flexible account types and tight pricing options |
| XM | Multi-jurisdiction group; entities commonly include CySEC, ASIC, DFSA, FSCA and others | From 0.0 pips on Zero; standard accounts are usually around 1.0 pip or more | MT4, MT5 | Traders who want strong education support and a familiar platform set |
| HFM | Multi-jurisdiction group; entities commonly include FCA, CySEC, FSCA, DFSA, FSA Seychelles and others | From 0.0–0.1 pips on tighter accounts; standard accounts are wider | MT4, MT5, WebTrader, HFM App | Traders who want a broad mix of account types and multi-platform access |
| FBS | Multi-jurisdiction group; entities commonly include ASIC, CySEC, FSC Belize and others | From about 0.7 pips on standard accounts; tighter pricing on specific account types | MT4, MT5, FBS App | Beginners and mobile-first traders who want simple platform access |
XM is often a comfortable middle ground for learners, while FBS works well when mobile trading and simple setup matter most.
The real trick is matching the broker to the way the trade is executed, not just the spread shown on a landing page.
Get that part right, and the rest of the workflow feels much less fragile.
Turning Chart Reading Into a Real Trading Edge
The chart never promised certainty; it only gives structure.
The most valuable habit is treating technical analysis as a decision framework, not a prediction machine.
Breakouts, indicators, and trend lines matter most when they are filtered through risk rules and position size.
That is why the failed breakout example matters so much.
The trade was never just about the entry; it was about whether the stop made sense, whether the spread was manageable, and whether the setup still held after a retest.
Backtesting and walk-forward testing are what separate a pattern that looks elegant on a screen from one that can survive live conditions.
Before the next trade, compare brokers on the things that actually affect execution: spreads, platform stability, and how cleanly orders fill when the market moves fast.
A practical place to start is forex brokers in south africa, then test one setup in a demo or with very small size.
If the setup cannot survive that pass, it was never ready for your money.