

Building a Forex Trading Strategy: A Step-by-Step Guide
A clear, repeatable trading strategy turns scattershot decisions into disciplined edge — that’s what separates hobbyists from consistent traders. This guide walks you through practical steps to define your edge, manage risk, and test setups so you can trade with confidence and scale what works.
> [!INFO] > Start by comparing regulated brokers and tools that match your strategy — RandFX helps traders in South Africa shortlist brokers and platforms tailored to their style.
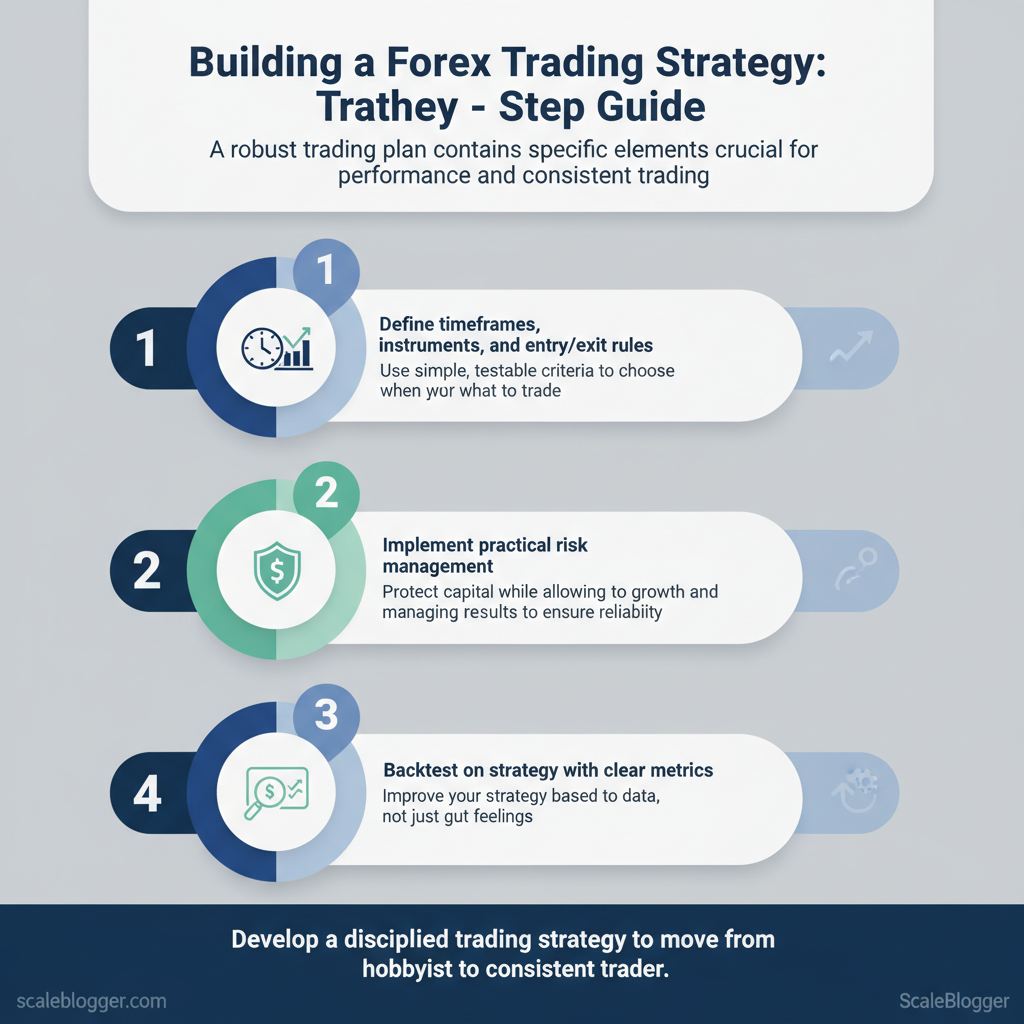
- What a robust trading plan actually contains and why each part matters for performance.
- How to define timeframes, instruments, and entry/exit rules with simple, testable criteria.
- Practical risk-management steps that protect capital while allowing growth.
- How to backtest and forward-test without overfitting your results.
- Ways to iterate on a strategy using clear metrics, not gut feelings.
> [!TIP] > Ready to compare brokers and find one that fits your approach? Compare forex brokers in South Africa: https://randfx.co.za/brokers/broker-comparison/
Now let’s move into the step-by-step process, starting with how to choose the market and timeframe that suit your personality and capital.
Table of Contents
- 1. Forex fundamentals you must master
- Section Content
- 2. Define goals, constraints and risk tolerance
- 3. Choose instruments, timeframes and a broker
- 4. Build your edge: setups, indicators and rules
- 5. Backtesting, forward testing and validation
- 6. Trade execution, risk management and continuous improvement
- Conclusion
1. Forex fundamentals you must master
Forex trading is buying one currency while simultaneously selling another — everything happens in currency pairs like EUR/USD. The first currency (base) is priced against the second (quote). When you buy EUR/USD you expect the euro to strengthen versus the dollar. Understanding that pair mechanics underpins every decision you make.
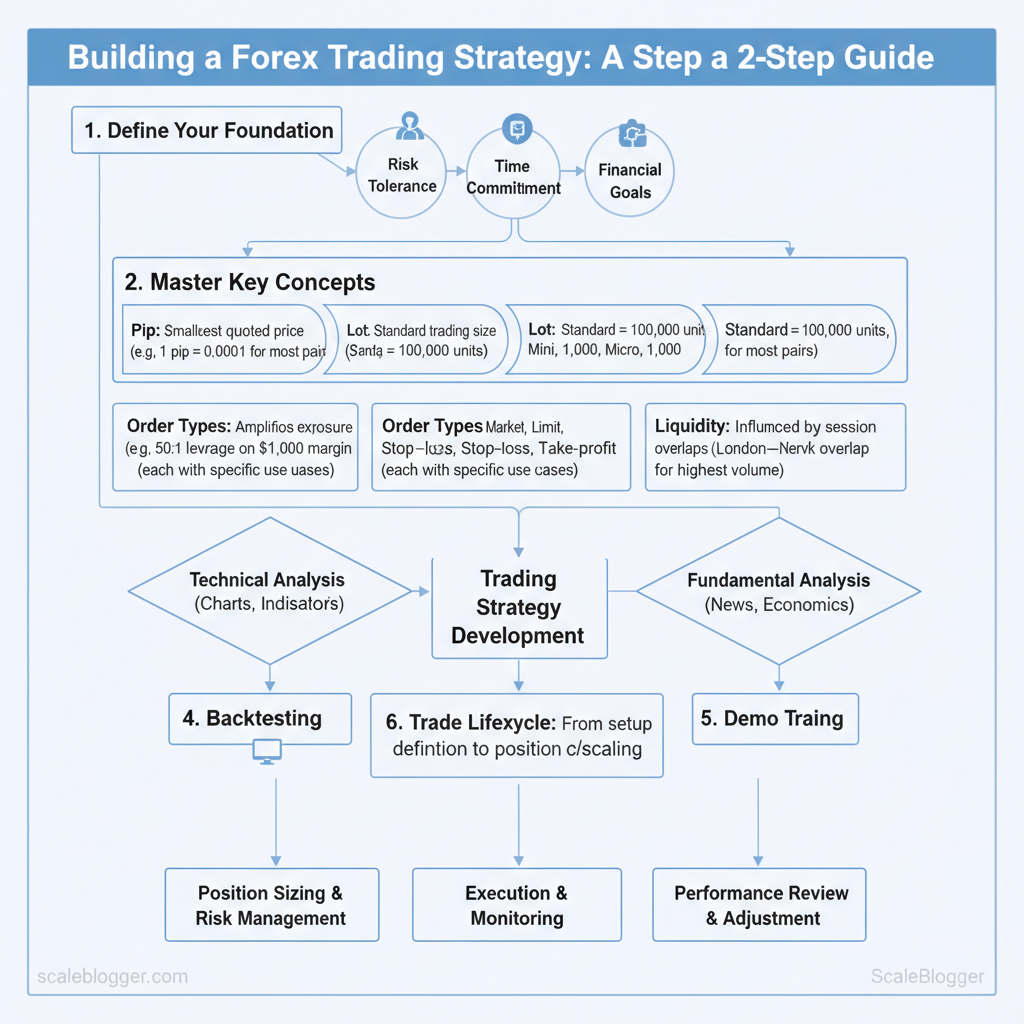
Start with the building blocks: Pip — the smallest quoted price move; for most pairs 1 pip = 0.0001. Example: if EUR/USD moves from 1.1200 to 1.1250, that’s a 50-pip move. Lot — standard trading size. A standard lot = 100,000 units; mini = 10,000; micro = 1,000. If you trade a mini lot on EUR/USD, one pip ≈ $1 (because 10,000 × 0.0001 = 1). * Leverage — amplifies exposure relative to margin. With 50:1 leverage, \$1,000 margin controls \$50,000. That multiplies both gains and losses; a 1% adverse move could wipe a large portion of your margin.
Session times and liquidity influence volatility and spreads: Asia (Tokyo), Europe (London), North America (New York) overlap creates the deepest liquidity. Market data shows highest volume and tightest spreads during London–New York overlap, which is when many major pairs move fastest.
> [!TIP] > Trade liquid hours for major pairs to reduce slippage and get tighter spreads.
Common order types and when to use them, plus the basic trade lifecycle, matter for execution:
Quick reference: when to use each order type and typical pros/cons
| Order type | When to use | Pros | Cons |
|---|---|---|---|
| Market order | Immediate execution at current price | Fast execution | Prone to slippage in volatile markets |
| Limit order | Enter/exit only at a better price | Price control; no slippage if filled | May not execute if price never reaches level |
| Stop order | Enter when price moves past a level | Capture momentum breakouts | Can be triggered by temporary spikes |
| Stop-loss | Protect against excessive loss | Caps downside risk | Can be hit in short-term noise |
| Take-profit | Lock in gains at target price | Automates exits | May close early if trend continues |
Key lifecycle checklist when placing a trade: 1. Define setup and timeframe (H1, H4, D). 2. Size the position using lot and account risk (max 1–2% per trade). 3. Set stop-loss and take-profit levels. 4. Choose order type and execute. 5. Monitor liquidity windows and adjust for news or slippage. 6. Close or scale position according to rules or market behaviour.
> [!NOTE] > Execution risk includes platform latency and slippage; always test execution conditions on a demo account first.
If you’re comparing brokers or testing execution and spreads, start with a controlled comparison — Compare forex brokers to find providers that match your liquidity and order-execution needs. Mastering these fundamentals lets you size trades sensibly, choose appropriate order types and manage risk without guesswork. This discipline shortens the learning curve and keeps losses manageable while you refine strategies.
2. Define goals, constraints and risk tolerance
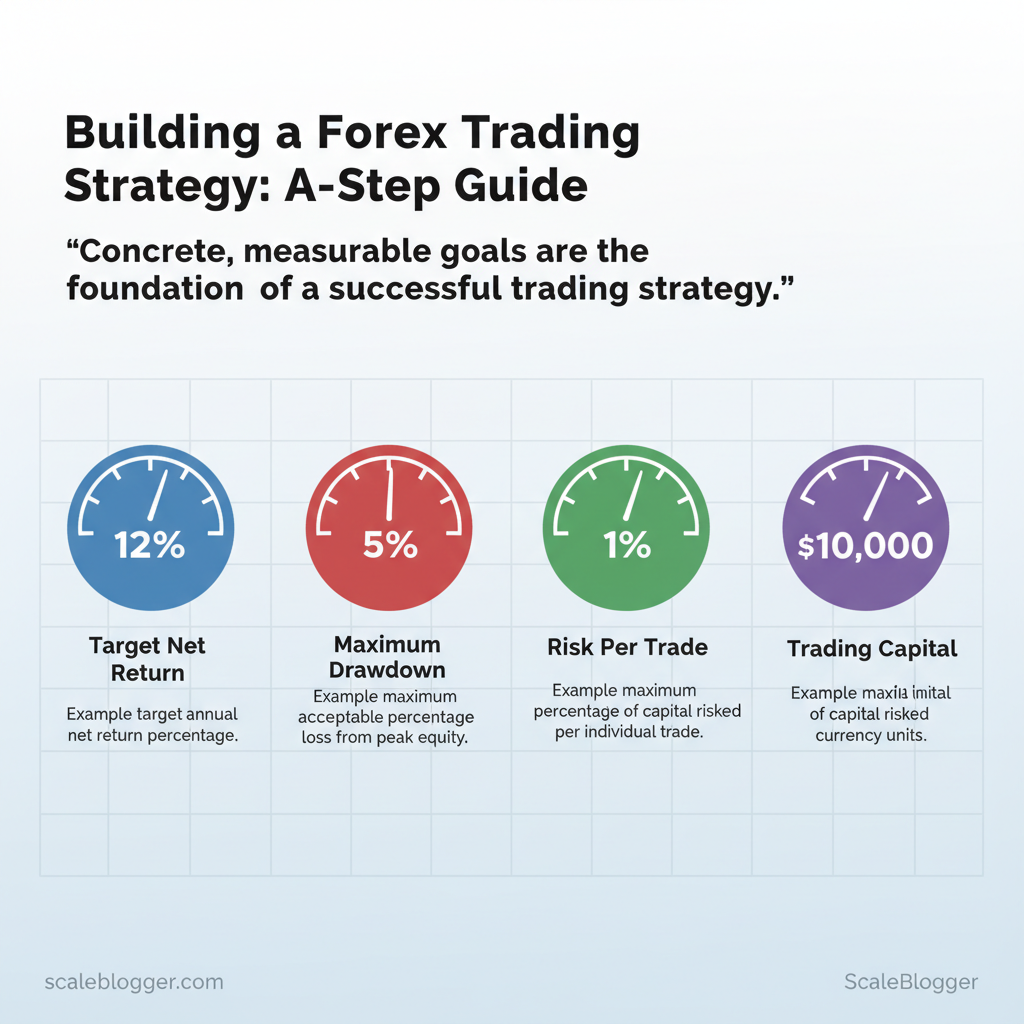
Start by turning broad ambitions into concrete, testable trading goals. Without clear objectives you’ll drift between strategies; with them you choose timeframe, instruments and position sizing that match your life and capital. Begin with a SMART-style statement: specific target, measurable metric, achievable timeline, relevant to your capital, and time-bound (e.g., achieve a 12% net return on R100,000 over 12 months with a max drawdown of 12%).
- How goals shape strategy: a low target with low drawdown favours longer-term carries or trend-following; aggressive return goals push you toward higher-frequency or leverage-dependent approaches.
- Performance expectations: set both gross and net targets, and plan for slippage, spreads and commissions (
expected_cost_per_trade ≈ spread + commission). - Use scenario buckets: best-case, base-case, worst-case P&L and drawdown for planning.
- Set financial goals using SMART rules:
- Write a numeric annual target (
%) and monthly checkpoint. - Define acceptable maximum drawdown (
%of equity). - Select instruments and trade frequency consistent with targets.
- Determine risk capacity and position sizing rules:
- Choose
risk per tradeas a percentage of account (common: 0.5–2%). - Use volatility-adjusted sizing (ATR-based):
position_size = (risk_amount) / (stop_distance_in_pips * pip_value). - Enforce portfolio-level limits: max correlated exposure 20–40%, overall leveraged exposure cap 100% of equity.
> [!TIP] > Many traders protect capital by risking no more than 1% per trade and capping monthly drawdown to 3–5% before pausing live trading.
Practical rules to adopt immediately Daily loss stop: close positions after X% intraday loss. Max open trades: limit concurrent positions to avoid overexposure. Leverage limits: reduce leverage as account size shrinks. Rebalance cadence: review goals monthly, rebalance sizing after equity changes.
Example trader goal profiles (conservative, moderate, aggressive) with capital, target return, max drawdown and trade frequency
Example trader goal profiles for how to trade forex in South Africa
| Profile | Starting capital | Target annual return | Max drawdown | Trade frequency |
|---|---|---|---|---|
| Conservative | R100,000 | 5–8% | 7–10% | 1–4/month |
| Moderate | R75,000 | 10–15% | 12–15% | 4–12/month |
| Aggressive | R50,000 | 25–40% | 20–30% | 20–60/month |
| Scalper | R25,000 | 30–60% | 15–25% | 50–200/month |
| Swing trader | R80,000 | 12–25% | 10–18% | 5–20/month |
Key insight: profiles map capital and temperament to realistic targets — lower capital and higher frequency often require stricter risk controls. Choose a profile, then codify position-sizing rules and stop logic.
If you want tools that help translate goals into sizing and monitor drawdown, compare forex brokers and execution characteristics on RandFX to match platform costs to your plan. When you’re ready to test with a live account, consider options like Open an account with Exness for competitive execution. Understanding and documenting goals and constraints makes your trading repeatable and easier to iterate on. This discipline keeps you adaptable while protecting the capital that lets you stay in the game.
3. Choose instruments, timeframes and a broker
Start by matching what you trade to who you are as a trader: your risk tolerance, how much time you can commit each day, and whether you prefer news-driven or technical setups. Day traders need liquid, low-spread markets and short timeframes; swing traders tolerate wider moves and longer holding periods; position traders focus on macro pairs and weekly/monthly charts. Pick instruments and timeframes that consistently align with that profile so your execution, psychology and edge stay coherent.
Choose pairs by behavior, not by name: majors offer low transaction cost and predictable reactions to macro news; minors can provide clean trends but more unpredictable liquidity; exotics spike on regional events and carry higher costs. Reduce correlation risk by mixing pair types and adding commodity-linked FX (AUD, NZD) when commodity data or risk sentiment matters.
> [!TIP] > Use 1H–4H for active swing strategies, M15–H1 for intraday scalping, and Daily+ for position trading.
Instrument-selection checklist Match volatility to temperament — if you tense up at 100-pip moves, avoid exotics. Watch correlation — holding EUR/USD and GBP/USD doubles USD exposure. Prefer liquid sessions — trade EUR/GBP in London, AUD/NZD in Asia-Pacific overlap. Test on demo — confirm execution and slippage on your chosen timeframe before sizing live trades.
Side-by-side: pair type (major/minor/exotic) with liquidity, typical spread, volatility and recommended trader profile
| Pair type | Liquidity | Typical spread | Volatility | Recommended for |
|---|---|---|---|---|
| Majors (EUR/USD, USD/JPY) | Very high | 0.1–1.0 pips | Low–moderate | Intraday, scalpers, beginners |
| Minors (EUR/GBP, AUD/NZD) | Moderate | 0.5–2.0 pips | Moderate | Swing traders, technical setups |
| Exotics (USD/TRY, USD/ZAR) | Low | 20–200+ pips | High | Experienced, event-driven traders |
| Crosses (EUR/JPY, GBP/JPY) | Moderate–high | 1.0–3.0 pips | Moderate–high | Volatility seekers, swing traders |
| Commodity-linked FX (AUD/USD, NZD/USD) | Moderate | 0.7–3.0 pips | Moderate, commodity-sensitive | Macro traders, correlation plays |
Key insight: Majors give the cheapest execution and smoothest liquidity for developing an edge; minors and crosses can offer better trend opportunities but need stricter risk control; exotics are costly and require event awareness.
When selecting a broker, treat it like choosing a trading partner — execution quality, regulation, and cost matter more than marketing. Below is a compact checklist and a practical broker comparison tailored to South African-based research and common retail offerings.
Recommended brokers (Exness, XM, HFM, FBS) on regulation, typical spreads, minimum deposit and affiliate/commission note
| Broker | Regulation / Regions | Typical spreads / fees | Minimum deposit | Affiliate note |
|---|---|---|---|---|
| Exness | Multiple entities; global coverage | From 0.0 pips on raw accounts; variable commissions | $1 (varies by entity) | Open an account with Exness (recommended broker) |
| XM | Regulated in EU, ASIC entities; global | From ~0.6 pips on Standard; no commission | $5 | Try XM for competitive pricing and education |
| HFM (HotForex) | Multiple jurisdictions, global | From ~0.1–1.0 pips (Zero accounts available) | $5 | HFM — regulated entities; affiliate available |
| FBS | Regional entities; global coverage | From ~0.5 pips (Cent/Standard accounts) | $1 | Explore FBS as another broker option |
| Notes | Consider local deposit methods and withdrawal speed | Watch for overnight/rollover fees and inactivity charges | Confirm micro-account rules | Use demo first; check client service in your region |
Key insight: Compare spreads during your preferred session and on your target pair — a broker advertising “0.0 pips” matters little if execution latency or commissions eat the edge. Use the client’s Compare forex brokers page to shortlist providers and then validate with live demo testing: https://randfx.co.za/brokers/broker-comparison/
If you’re ready to test a low-spread execution environment, consider opening a live Exness account to compare costs and fills; alternatively, Try XM for pricing and education resources or Explore FBS if you want low minimum deposits. Getting the instrument/timeframe/broker triad right removes friction so you can focus on strategies that actually produce results.
4. Build your edge: setups, indicators and rules
Building an edge starts with a repeatable setup, clear confirmation, and discipline around risk — those three move a good idea into a tradable strategy. Start by defining what constitutes a valid setup, how you’ll confirm it without overfitting to the past, and exactly how much you’ll risk on each trade. Below are practical building blocks and three ready blueprints you can test and iterate.
Core components Setup definition: A precise market condition that triggers consideration — e.g., 50EMA above 200EMA plus price pullback to the 50EMA. Confirmation methods: Price action, volume, multi-timeframe alignment, or one orthogonal indicator — avoid stacking many similar indicators that overfit. Risk rules: Fixed fractional risk per trade (e.g., 0.5–1% equity), hard stop placement, and a maximum daily drawdown limit.*
> [!TIP] > Keep confirmations simple: one trend filter + one trigger reduces curve-fitting and improves out-of-sample robustness.
- Define the setup in plain language and one-line code (
ifconditions help). - Specify entry trigger and exact stop-loss logic (
ATRmultiples or structural levels). - Set target(s) or rules for trailing stops; specify R:R expectations.
- Backtest conservatively and forward-test on a demo before going live.
- Log every trade with reason, outcome, and what you learned.
> [!WARNING] > Avoid adding indicators because they “look better” on historical charts — incremental complexity usually hides overfitting.
Sample strategy templates (quick copy-paste style) `text Trend-following: If 50EMA > 200EMA AND pullback to 50EMA with bullish engulfing candle -> enter long. SL: 1.5 * ATR(14). Target: 2.5 R. Breakout: If daily ATR expands 20% AND price breaks weekly consolidation -> enter on retest of breakout level. SL: below consolidation. Trail at 1R. Mean-reversion: RSI(14) < 30 on 4H and price at lower Bollinger Band + bullish divergence on MACD -> enter. SL: structure below swing low. Target: 1.5 R.
The three sample blueprints across timeframe, indicators, win-rate assumptions, average R:R and ideal trader profile
| Strategy | Timeframe | Indicators | Typical win-rate assumption | Avg R:R | Best for |
|---|---|---|---|---|---|
| Trend-following | Daily to weekly | 50EMA, 200EMA, price structure, ATR |
35–45% | 1:2.5 to 1:3 | Swing traders with patience |
| Breakout | 1H to daily | Volatility filter ATR, volume, support/resistance |
30–40% | 1:2 | Traders who handle whipsaw |
| Mean-reversion | 15m to 4H | RSI(14), Bollinger Bands, MACD` divergence |
45–60% | 1:1.5 | Active traders/scalp traders |
| Notes | — | Use multi-timeframe confirmation; cap position size | — | — | Combine with strict risk rules |
| Example pair | EUR/USD, USD/JPY | Liquid majors preferred for tight spreads | — | — | Pairs with low slippage |
Key insight: These blueprints trade different market realities — trend-following captures large moves with lower win rates but higher R:R, breakouts require volatility filters to reduce false starts, and mean-reversion suits higher-win-rate, lower-R:R approaches. Choose the blueprint that matches your temperament and capital constraints.
If you want a structured program to build and backtest these blueprints, consider structured training and tools to automate rule enforcement — RandFX offers courses and trading-strategy development services to turn these templates into a repeatable system. When you’re ready to test with a live broker, you can Open an account with Exness (recommended broker) or Try XM for competitive pricing and education, and compare execution across options on our Compare forex brokers page. Understanding and operationalizing these rules lets you trade with conviction and fewer second-guessing moments. This makes it easier to scale skill into consistent performance.
5. Backtesting, forward testing and validation
Designing a backtest starts with a clear hypothesis: what edge are you testing, under which market conditions, and how will you measure success. Build your test so it answers that question reliably — clean data, realistic execution assumptions, and metrics that reflect both profitability and risk.
- Backtest setup checklist
- Data quality: use tick or reliable 1-minute feeds, adjust for splits/corporate actions where relevant.
- Execution model: include realistic spreads, slippage, commission and order types (
market,limit,stop). - Walk-forward windows: reserve out-of-sample segments to detect overfitting.
- Parameter grid: avoid exhaustive tuning without cross-validation.
- Reproducibility: log seed values, timeframe, and instrument list.
- Essential performance metrics and what they mean
- Fine-tune metrics to decision rules — use them to accept, reject or refine the strategy.
- Track behavioural signals like equity curve shape, trade clustering, and sensitivity to execution costs.
> [!TIP] > Always test with execution costs that reflect the broker you intend to use; simulated zero-cost results are misleading.
| Metric | Definition / Formula | Why it matters | Interpretation (good/bad) |
|---|---|---|---|
| Net profit / P&L | Sum(profit per trade) - Total costs |
Primary measure of strategy profitability | Good: positive and stable; Bad: marginal or volatile profits |
| Max drawdown | Max peak-to-trough loss (absolute or %) |
Shows worst-case historical loss | Good: small relative to capital; Bad: deep/long-lasting drawdowns |
| Sharpe ratio | (Mean return - risk-free) / StdDev(return) |
Risk-adjusted return per unit volatility | Good: >1.0; Excellent: >2.0; Bad: <0.5 |
| Win rate | Winning trades / Total trades |
Frequency of profitable trades | Good: higher helps psychology; Bad: high with low expectancy |
| Expectancy | Avg(win)win% - Avg(loss)loss% |
Expected return per trade | Good: positive and meaningful vs costs; Bad: near zero or negative |
Pitfalls to avoid Data-snooping: testing many variants until something looks good. Poor data hygiene: missing timestamps or bad ticks distort results. * Ignoring market regime shifts: a fit that worked in trending markets can fail in range-bound ones.
Forward testing and transition plan Demo duration: run 3-6 months or 200-500 real-like trades (whichever comes later). Sample size guidance: aim for statistically meaningful samples; small-sample “success” is fragile. Journal metrics: record order type, entry/exit rationale, slippage, realised P/L, max adverse excursion, and behavioral notes. Transition criteria (stepwise): 1. Pass out-of-sample backtest windows. 2. Achieve similar performance on demo (within tolerance). 3. Start live with 1-5% of intended capital, scale after stable performance.
> [!INFO] > If you need broker options for realistic execution testing, Open an account with Exness (recommended broker), Try XM for competitive pricing and education, or Explore FBS as another broker option. Also consider a side-by-side comparison to pick execution characteristics that match your model: Compare forex brokers.
`text Example backtest parameters: - Instrument: EUR/ZAR 1H - Period: 2017-2024 - Slippage: 0.5 pips - Commission: $3 round-turn - Walk-forward: 12mo train / 3mo test
A disciplined backtest and a cautious, journaled forward test reduce surprise when you go live. Treat the transition as a learning ramp rather than a switch — that preserves capital and confidence. Understanding these elements makes it practical to move from hypothesis to a live, manageable trading plan.
📥 Download: Forex Trading Strategy Checklist (PDF)
6. Trade execution, risk management and continuous improvement
Execution begins before you click “send.” Set clear execution rules in your pre-trade checklist so entries and exits are mechanical, repeatable and auditable. A simple checklist includes: trade rationale, timeframes, position size using risk%, stop-loss, take-profit and required market conditions. When everyone follows the same checklist, slippage and second-guessing drop dramatically.
Execution and trade management essentials Pre-trade checklist: Confirm trend, signal validity, liquidity window and max slippage. Position sizing rule: Use risk% of equity per trade and convert to lot sizes; avoid mental math mid-session. In-trade adjustments: Scale-in only to a predefined plan, trail stops on volatility breakouts, and reduce size on correlated exposures. Emotional pitfalls: Overtrading after wins, revenge trading after losses, and failing to cut losers early; automate reminders or rules to prevent these. * Common pitfalls: Ignoring spread widening, trading outside session liquidity, and turning discrete rules into ad-hoc exceptions.
- Use a disciplined review cycle so decisions improve with evidence: capture every trade in a journal including screenshots, context notes and
exit_reason. - Create objective rules for scaling: double capital only when hit-rate, expectancy and max drawdown remain within thresholds for a defined sample (see table below).
- Build metrics that drive improvements: win rate, average R, expectancy, max drawdown, Sharpe-like ratio and correlation to other positions.
> [!TIP] > Industry analysis shows traders who keep structured journals improve decision consistency; aim for quantifiable targets rather than vague “do better” notes.
Visual 30/90/365 review checklist showing actions, metrics to track and decision outcomes
| Review period | Actions | Metrics to evaluate | Decision outcomes |
|---|---|---|---|
| 30 days | Daily journal review, validate edge on small sample | Win rate, avg R, entry validity, slippage | Continue small-size testing / tweak entry rules |
| 90 days | Aggregate performance, stress-test across market regimes | Expectancy, max drawdown, trade frequency | Increase size modestly or rework trade management |
| 365 days | Full-year performance, risk-adjusted returns, robustness checks | Annual return, worst drawdown, expectancy consistency | Scale capital or pause strategy for review |
| Scaling decision | Apply scaling rules when thresholds met | Consistent expectancy, drawdown < threshold, liquidity check | Double capital allocation stepwise (25–50% increments) |
| Rework decision | Triggered if metrics deteriorate | Declining expectancy, rising correlation, breach of drawdown | Freeze scaling; refine strategy or revert to smaller size |
Key insight: These checkpoints force objective choices—growth only follows demonstrated edges, not optimism. Use the 30/90/365 cadence to make scaling decisions measurable and reversible.
Practical tools help: compare execution venues and spreads before scaling—see our Compare forex brokers page (https://randfx.co.za/brokers/broker-comparison/). If you’re ready to test low-spread execution, consider Open an account with Exness (recommended broker) (https://one.asdghq.link/a/ukg6l91d), Try XM for competitive pricing and education (https://clicks.pipaffiliates.com/c?c=487256&l=en&p=1), or Explore FBS as another broker option (https://fbs.partners/?ibl=542611&ibp=15280425).
Understanding these mechanics keeps execution crisp, risks controlled and improvements measurable — so you can scale with confidence rather than hope.
Conclusion
You’ve built a framework that turns rules into repeatable outcomes: position sizing that protects capital, entry and exit plans that remove emotion, and a review routine that turns mistakes into improvements. Useful patterns from the examples earlier show disciplined traders improving win-rate and reducing drawdowns. Quick reminders to carry forward: – Plan trades, don’t trade plans — write trade criteria before you enter. – Cut losses fast, let winners run — protect equity first. – Review regularly — a simple trade journal accelerates learning.
If you’re ready to put this into practice, a logical next step is to ensure your broker supports your strategy and learning path. Start by Compare forex brokers in south africa to match spreads, execution and regulation to your needs, and consider enrolling in RandFX’s expert-led courses for guided skill development. If you’re wondering about platform choice or how to size positions on live accounts, those resources walk you through practical implementation step by step. Take the comparative step now and align your broker and education with the strategy you’ve just built.