
A trader can watch EUR/USD spike on a routine Consumer Price Index release and still miss the real reason it moved.
The market is not reacting to the number alone.
It is reacting to how that number changes the odds of higher or lower interest rates.
That is why economic indicators matter so much in forex.
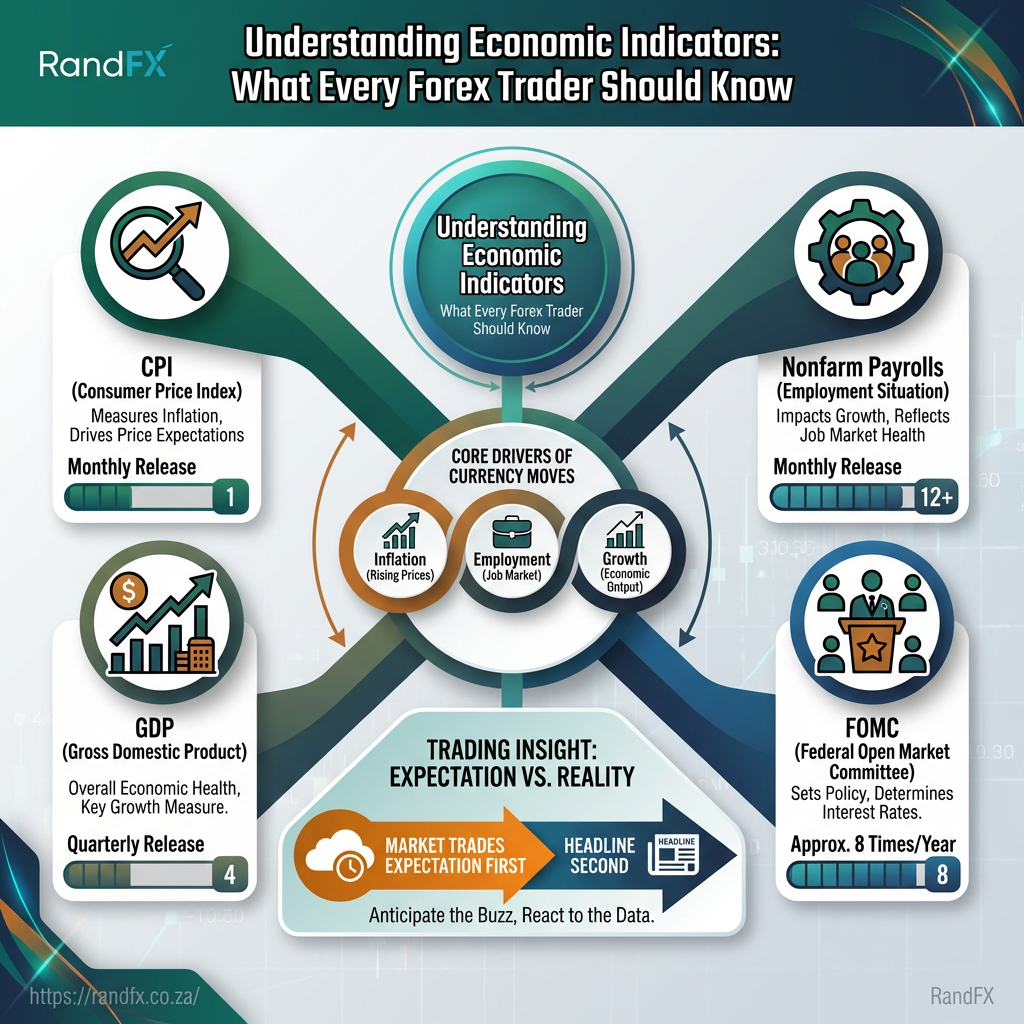
Inflation, Nonfarm Payrolls, GDP, and PMI data all feed into what central banks might do next, and currency prices move fast when those expectations shift.
In 2026, the U.S. CPI arrives monthly, the Employment Situation report arrives monthly, GDP comes quarterly, and the FOMC meets about eight times a year, so traders live with a steady stream of policy clues.
The trap is treating every release the same.
A headline can look strong while the details stay soft, or a weak print can be less important if the central bank has already signaled patience.
That is where the forecast, the prior reading, and the components of the report matter more than the headline score.
A good trader reads the calendar like a map, not a scoreboard.
Scheduled releases can widen spreads and shake liquidity in seconds, which is exactly when poor entries get punished.
Once the numbers hit, the real question is simple: does this push policy expectations toward tighter or looser conditions?
What Economic Indicators Are and How They Influence Forex
A stronger-than-expected CPI print can lift a currency in minutes.
Traders are not just reading the number; they are reading the policy pressure behind it.
Economic indicators are data releases that show how an economy is doing on inflation, jobs, growth, and demand.
In forex, that matters because currencies move on expected interest rates, not just on headlines.
The timing matters just as much as the data itself.
In 2026, U.S. CPI is released monthly, the Employment Situation report lands monthly, GDP is quarterly, and the FOMC meets about eight times a year, so traders constantly compare fresh data with policy expectations.
Quick reference: indicator types and timing
| Indicator Type | Example Indicator | Typical Release Timing | Trader Implication |
|---|---|---|---|
| Leading | PMI | Monthly | Early signal for growth and FX bias |
| Coincident | GDP (seasonally adjusted) | Quarterly | Confirms the current trend |
| Lagging | Unemployment Rate | Monthly | Confirms labor-market direction after the move |
| Real-time | Retail sales | Monthly | Immediate consumer demand signal |
| Sentiment | Consumer confidence | Monthly | Risk appetite clue and short-term bias |
GDP usually confirms what the market already suspects, while unemployment tends to validate an economic story that has been building for months.
Three transmission channels do most of the work.
- Interest-rate expectations: Hot inflation or strong labor data can push traders to expect tighter policy, which tends to support that currency.
- Growth surprises: A better growth print can lift long-term currency sentiment, especially if it changes views on future central-bank action.
- Risk-on and risk-off flows: Strong global sentiment often supports higher-yielding currencies, while panic tends to favor safe havens like the yen or the dollar.
The cleanest trading habit is to compare actual vs. forecast, then ask whether the release changes the policy path.
A small miss on a headline number may matter less than a big shift in a core component, wages, or revisions.
That is why traders watch the data calendar, the central bank, and the market reaction together.
One print rarely tells the whole story, but the right indicator at the right time can change the whole tone of a currency pair.
The Most Important Indicators Forex Traders Must Track
CPI gets most of the attention for a reason.
It lands monthly in the U.S. in 2026, and every release gives traders a fresh read on whether the central bank can stay patient or has to lean harder against prices.
PPI matters too, but it plays a different role.
It is more of an early warning light than a final verdict, so traders often watch whether producer costs feed into consumer inflation over the next few months.
GDP and the labor market round out the picture. U.S. Nonfarm Payrolls and the unemployment rate arrive monthly, while GDP prints quarterly, so the market usually reacts hardest to payrolls and treats GDP as a slower confirmation of the growth trend.
Inflation and policy signals
| Release | What it measures | Why FX traders care | Typical immediate FX reaction |
|---|---|---|---|
| CPI | Consumer price changes | Signals inflation trends and rate pressure | Currency strengthens on an upside surprise, especially if core is firm |
| PPI | Producer prices | Early sign of cost pressures | Volatile; follow-through depends on whether costs pass through to CPI |
| Central Bank Decision | Policy rate and statement | Directly shifts interest-rate differentials | Strong directional impact if the tone turns hawkish or dovish |
| Inflation Expectations | Surveys and breakevens | Shows where markets think inflation is headed | Affects forward rates and broader pricing across the curve |
| Core vs Headline | Inflation excluding or including volatile items | Core often lines up better with policy focus | Core surprises often move markets more than headline prints |
Forward guidance matters just as much as the number.
When the FOMC has about eight scheduled meetings a year in 2026, every statement, press conference, and dot-plot style clue can shift rate expectations before the next data release even lands.
GDP and payrolls deserve a different kind of attention.
GDP is usually a slower, confirmatory signal, while Nonfarm Payrolls can hit the market hard in seconds, so trade size should shrink when surprise risk is high and spreads are likely to jump.
A simple workflow helps here:
- Check the calendar first. High-impact releases can widen spreads and trigger fast spikes.
- Compare actual vs forecast. The gap versus consensus often matters more than the headline alone.
- Watch core details. Core inflation, wages, and unemployment often tell the real story.
- Scale down before payrolls. Surprise-driven moves can punish oversized positions fast.
Reading the data the way traders do
A strong inflation print only matters if it changes what rates are expected to do next.
That same logic applies to labor data, which is why traders keep one eye on unemployment and another on the central bank’s reaction pattern.
The best setups usually come from pairing inflation with policy, then growth with labor.
That mix keeps the focus on the reaction function, not the noise.
Building a Practical Economic Calendar and News-Trade Workflow
A messy calendar is how decent setups get wrecked.
The fix is not more news; it is a tighter filter.
A proper economic calendar for forex traders should do three jobs at once.
It should show the release time, the market expectation, and the prior reading, then flag whether the event is likely to shake price hard or barely move it.
That extra layer matters.
A monthly CPI print or a central-bank decision can still be boring if the market already priced it in, while a smaller release can bite hard when positioning is crowded.
Sample one-day economic calendar for forex traders
| Time (UTC) | Indicator | Country/Currency | Consensus | Prior | Volatility Score | Trader Note |
|---|---|---|---|---|---|---|
| 08:30 | CPI (MoM) | USD | 0.3% | 0.2% | High | Watch for rates repricing |
| 09:00 | GDP (QoQ) | EUR | 0.4% | 0.3% | Medium | Trend confirmation |
| 12:30 | Retail Sales | GBP | 0.5% | -0.1% | Medium | Consumer demand signal |
| 14:00 | Unemployment Rate | USD | 3.9% | 4.0% | High | NFP-related flows |
| 21:30 | RBA Decision | AUD | — | — | High | Policy surprise risk |
The consensus and prior fields help frame surprise risk, while the volatility score tells you whether to expect spreads and slippage to widen.
The real edge comes from tagging each release by trading style.
Scalpers care about fast liquidity changes, while swing traders often care more about whether the event changes the broader policy path.
Trade execution rules around releases
- If volatility is high and size is large, stand aside.
Big positions and high-impact releases are a bad mix unless the plan already accounts for fast slippage.
- If volatility is high and size is small, use pending orders carefully.
- If the release is medium impact, trade only with a defined edge.
- If the pair is already stretched, cut risk first.
ATR-based stops help here because they scale to current movement instead of pretending every session is the same.
- Cap risk per event.
For news trades, the question is rarely “Will this move?” It is “Can the move be traded without getting chewed up first?” A calm calendar, a simple decision tree, and hard event risk limits usually beat improvisation.
Interpreting Surprises and Revisions — Real-World Examples
What if the market is not reacting to the number itself, but to what that number forces traders to believe about rates? That is usually the real game.
A strong U.S. CPI print from the BLS does not just mean inflation is hot; it can push Treasury yields higher, drag forward the odds of tighter Fed policy, and lift the dollar in minutes.
The sequence matters.
First comes the release.
Then rate repricing.
Then the FX move.
After that, the market decides whether the first push deserves follow-through or fades once central-bank language and bond yields settle down.
Revisions can be just as important.
A first GDP estimate can look clean, then later updates soften the story and change the policy read.
In FX, that kind of revision can matter more than the original headline, especially when traders were already stretched in one direction.
Payrolls show the same pattern, only faster.
The U.S. Employment Situation report lands monthly in 2026, and Nonfarm Payrolls can whip pairs around so sharply that the first tradable price is often the wrong one.
That is why the smarter approach is to watch yields, equity futures, and the next few minutes of price action before committing.
Payrolls shock and volatility management
| Trader Type | Pre-release Action | During-release Action | Post-release Action |
|---|---|---|---|
| Scalper | Close positions | Stand aside or use limit orders | Reassess after 5 mins |
| Day Trader | Reduce size by 50% | Avoid market orders | Enter on confirmed breakout |
| Swing Trader | Keep size but raise stops | Hold through if long-term thesis | Re-evaluate next day |
| Options User | Consider short-term straddle | Sell premium carefully | Close after 1–2 sessions |
| Institutional | Hedge with forwards | Use algos for execution | Rebalance exposure |
High-impact releases punish people who treat every print the same, because a small miss in quiet trade is not the same as a payroll shock with yields jumping and equity futures rolling over.
The cleaner habit is simple: check the surprise, confirm it in bond yields, then wait for the first emotional burst to cool.
When the move still holds after 5 to 15 minutes, it has a much better chance of being real.
Used that way, surprises become signals instead of traps.
Revisions stop looking like background noise and start looking like clues.
Combining Indicators with Technical Analysis — A Practical Strategy
A surprise on CPI day can still be a bad trade if the chart is fighting you.
That is why the cleanest news setups use two layers: the macro shock, then the market’s technical permission.
The practical template is simple.
First, the release must actually surprise the market.
Then price has to confirm the move with structure, not just a one-candle burst that fades in ten minutes.
That matters because central-bank-linked data, like U.S. CPI, Nonfarm Payrolls, and FOMC messaging, can move FX fast.
The trade only deserves risk when the chart agrees with the story.
Strategy template: surprise trigger plus technical confirmation
A strong release alone is not enough.
A strong release plus a broken range, a reclaimed moving average, or a clean retest is much better.
- Define the surprise trigger.
- Wait for technical confirmation.
- Embed the risk rules.
- Check the backdrop.
A simple example works well.
If U.S. CPI lands hot and EUR/USD breaks below the pre-release low, then retests that low and rejects it, the trade has both news and structure behind it.
Backtesting and forward testing fundamentals
Backtesting only works when the timestamps are real.
News strategies need release-timestamped data, because a five-minute delay can completely change the result.
Use the same event labels your trading platform or calendar would have given you.
Then test the strategy across different volatility regimes, because a quiet month and a FOMC week are not the same animal.
Backtesting and forward testing fields
| Metric/Field | Description | Why it matters |
|---|---|---|
| Entry Timestamp | Exact release/entry time | Necessary for event-driven strategies |
| Position Size | Units or % of account | Controls risk |
| Stop/Take Profit | Price levels and rationale | Measures risk-reward |
| Outcome | Win/Loss and R-multiple | Core performance metric |
| Market Context | Volatility and correlated asset moves | Helps segment results |
Record the setup, the reason for entry, the technical confirmation used, and whether the trade worked in high or low volatility.
That kind of logging turns a news idea into a repeatable process.
It also shows which releases deserve attention and which ones usually produce noise.
Practical Tools, Resources and Broker Considerations
A clean CPI read is useless if your fill turns ugly at the exact second of release.
Around news, the real edge often comes from the boring stuff: the calendar, the headline feed, and the broker’s execution.
For most traders, the best economic calendar for forex is the one that lets you filter by currency, impact level, and time zone without clutter.
Forex Factory and Investing.com do that job well, and both are easy to scan before London or New York opens.
Bond yields and money market pricing matter just as much.
If the data says one thing but yields barely move, the market may not believe the print yet.
Essential tools and data sources
| Resource Type | Recommended Tools | Primary Benefit | Practical Tip |
|---|---|---|---|
| Economic Calendar | Forex Factory / Investing.com | Timing and consensus tracking | Set local time and volatility filters, then mark only the pairs you trade. |
| News Feed | Reuters / Bloomberg alerts | Fast headlines and market color | Use headline-only alerts so you are not buried in noise. |
| Charting | TradingView / MT4 | Visual confirmation across timeframes | Keep one higher timeframe open while the release chart prints. |
| Bond/Yield Data | FRED Treasury yields / market data dashboards | Confirms rate expectations | Watch the 2-year yield before and after the release. |
| Money Market Pricing | Overnight index swaps / rate futures dashboards | Shows shifting policy odds | Compare the move with the surprise, not just the headline. |
| Central Bank Calendar | Federal Reserve / ECB meeting pages | Keeps policy dates in view | Mark decision days and press conferences separately. |
| Order Execution | Broker platform | Reveals spread, slippage, and fill speed | Test during a demo news session before risking size. |
| Custom Alerts | Calendar apps / broker notifications | Prevents missed releases | Set alerts 15 and 5 minutes before high-impact data. |
A narrow spread on the screen can widen fast, and slippage can wipe out a setup that looked fine five seconds earlier.
That is why broker choice deserves real attention, not just a quick signup.
A compare forex brokers page becomes useful when you want to check spreads, execution, and platform behavior side by side before you trade around news.
The habit that pays off is simple: confirm the event, confirm the rate story, then confirm the broker can actually fill the trade cleanly.
When those three line up, the rest gets a lot less messy.
Trade the Expectation, Not the Headline
A CPI release rarely moves EUR/USD because the number exists.
It moves because the market had already built a story around that number, and the release either confirmed it or tore it apart.
That is the habit worth keeping: watch the gap between expectation, previous data, and the actual print, because that gap is where the move starts.
The clearest example from earlier was the surprise-and-revision problem.
A headline can look ordinary, then a revised prior reading quietly changes the whole mood, while price only reacts once traders realize the old story no longer holds.
That is why the best traders do not treat indicators as isolated events; they line them up with trend, support, resistance, and risk around the release window.
Build the habit today. Open your economic calendar, mark the next two high-impact releases, and write down the consensus, the prior reading, and the level on your chart that would confirm or reject the move.
If broker execution matters for your news trading, forex brokers in south africa before the next big release and make sure your setup is ready before the market starts talking.