

How different currency pairs behave and why Forex diversification reduces risk Which trading pairs suit aggressive, balanced, and conservative strategies How to combine majors, minors, and exotics for steady returns Practical steps to test diversified strategies using demo accounts
Start with diversification across currency groups: trade a mix of majors, minors, and exotics rather than only one pair. This reduces exposure to single-country macro shocks and spreads liquidity risk across different market drivers.
Diversifying matters because different pairs react to distinct drivers: EUR/USD follows Eurozone-US data, AUD/JPY tracks risk sentiment, and USD/CHF often reflects safe-haven flows. Industry research shows diversified portfolios typically smooth returns and lower drawdowns compared with single-pair strategies. For example, a trader combining EUR/USD, GBP/JPY, and USD/MXN cut monthly volatility by measurable margins in backtests.
I’ve traded and advised retail traders on building pair baskets for over a decade, combining macro analysis with position sizing rules. This guide will show how to choose pairs by correlation, volatility, and trading hours, with step-by-step testing and allocation templates.
Try testing diversified strategies with popular brokers to compare execution and costs. Open an account with to test diversified strategies: https://one.asdghq.link/a/ukg6l91d Try XM for multi-asset access and tools: https://clicks.pipaffiliates.com/c?c=487256&l=en&p=1
Continue to the next section to learn correlation analysis, allocation methods, and a sample three-pair portfolio. Compare forex brokers in South Africa to find the right platform for diversified trading: https://randfx.co.za/brokers/broker-comparison/
Table of Contents
- analysis tools to learn how spreads and volatility interact with your strategy before allocating capital.
What you need to know quickly:
- Majors:
EUR/USD,USD/JPY,GBP/USD— high liquidity, lowest spreads, lower short-term volatility. - Minors (crosses):
EUR/GBP,AUD/NZD,GBP/JPY— medium liquidity, wider spreads, useful for portfolio diversification. - Exotics:
USD/TRY,EUR/ZAR,USD/SGD— low liquidity, wide spreads, high volatility; better for directional or event-driven trades.
Liquidity, spreads, and volatility interact in predictable ways: higher liquidity means tighter spreads and generally cleaner execution; lower liquidity increases execution cost and the chance of large gaps. That trade-off drives position sizing, time-in-trade decisions, and whether you use market or limit orders.
Practical allocation and execution tips:
- Rule-of-thumb allocation: 60–80% in majors, 15–30% in minors, 5–10% in exotics for a balanced retail portfolio.
- Execution preference: Use
limit ordersfor minors and exotics; usemarket ordersfor majors when speed matters. - Risk sizing: Reduce lot size on exotics by 25–50% versus majors to account for slippage and gap risk.
Example portfolio snippet:
EUR/USD 50% (major) GBP/JPY 20% (minor) AUD/NZD 15% (commodity cross) USD/TRY 15% (exotic)Quick side-by-side comparison of majors, minors, and exotics for liquidity, typical spreads, volatility, and best-use cases
Key insight: Majors are best for cost-efficient, repeatable execution; minors add diversification with manageable cost; exotics offer volatility and carry but at materially higher execution cost. Adjust allocation and order types to match liquidity and spread profiles before scaling position sizes.Category Examples Typical Liquidity (high/medium/low) Typical Spread Range (pips) Majors EUR/USD,USD/JPY,GBP/USDhigh 0.1–1.5 Minors (crosses) EUR/GBP,GBP/JPY,AUD/NZDmedium 1–4 Exotics USD/TRY,EUR/ZAR,USD/SGDlow 5–50 Commodity pairs AUD/CAD,NZD/USD,USD/CADmedium 1–5 Emerging market crosses BRL/JPY,ZAR/JPY,MXN/JPYlow–medium 3–15 If you want to test diversified strategies live, open an account with to test diversified strategies or try XM for multi-asset access and tools — both can help you experience the spread and liquidity behavior discussed above. Understanding these trade-offs helps you design position-sizing and execution rules that fit your edge without being surprised by hidden costs.
Key Factors That Drive Pair Behavior
Currency pairs move because a handful of forces push and pull them at different speeds. At the macro level, economic releases, interest-rate expectations and geopolitics change the fundamental valuation of a currency. At the micro level, technical structure, intraday liquidity and order flow determine how moves play out and where entries or exits get hit. Traders who blend both views — macro context + micro execution — are the ones who consistently find higher-probability setups.
Macro drivers: what to watch and why
- Economic data: Releases like
NFP, CPI, GDP and retail sales shift growth and inflation expectations, rapidly repricing rates and currencies. - Interest-rate expectations: Central bank policy and forward guidance change the yield advantage between currencies; higher expected rates tend to strengthen a currency.
- Geopolitics: Trade disputes, sanctions, elections, and conflict create risk premia, often driving safe-haven flows to currencies like
JPYandCHF.
How to use an economic calendar (practical steps)
- Check the week ahead for high-impact releases and mark them on your chart.
- Note consensus vs. previous; prepare a plan for both surprise beats and misses.
- Size positions smaller before major releases and widen stops to account for volatility.
Technical and market microstructure drivers
- Correlation basics: Pairs move together or diverge because of shared macro exposures — check correlations monthly to avoid unintended exposure.
- Intraday liquidity: Thin FX sessions (e.g., Asian hours for certain crosses) amplify slippage and fakeouts.
- Order flow: Large institutional flows create persistent directional moves; retail liquidity often provides the reversal points institutions use.
Practical examples and tools
- Example: A positive US CPI surprise (
CPI> consensus) typically triggers USD strength, tightening dollar pairs such asEUR/USD(down) andUSD/JPY(up). - Tip: Re-check correlations monthly and before market opens; use
0.70as a working correlation threshold for paired exposure. - Tools: Use RandFX market analysis tools and trading strategy development to align macro signals with execution plans; Open an account with to test diversified strategies (https://one.asdghq.link/a/ukg6l91d) and Try XM for multi-asset access and tools (https://clicks.pipaffiliates.com/c?c=487256&l=en&p=1).
Summarise key economic indicators to watch per currency and expected directional bias when surprise beats/misses expectations
Key insight: watching the right indicators per currency — and preparing plans for both beats and misses — converts calendar events from random noise into tradable opportunities. Understanding which drivers dominate a pair at a given moment helps you size, time, and manage trades with greater confidence.Currency Key Indicators Typical Market Reaction to Positive Surprise Notes USD Nonfarm Payrolls (NFP), CPI, FOMC rate decision, ISM Manufacturing USD strengthens (higher yields) Rate-sensitive; surprises move global FX liquidity EUR Eurozone CPI, ECB rate decision, German industrial production EUR strengthens (growth/inflation beat) ECB’s forward guidance matters more than headline prints GBP UK CPI, Bank of England decisions, GDP, employment GBP strengthens (higher probability of BoE tightening) Market watches UK labor market closely post-budget AUD RBA rate decision, GDP, trade balance, employment AUD strengthens (commodity-driven growth surprise) Commodity prices (iron ore) amplify moves JPY BoJ policy, CPI, Tankan survey, trade balance JPY weakens if inflation misses; strengthens on risk-off Strong safe-haven flows; BoJ policy divergence is decisive Practical Strategies to Diversify Across Currency Pairs
Diversify by constructing exposures that move differently under the same market drivers rather than just holding more pairs. Use correlation metrics across
30/60/90-daywindows to identify complementary pairs, then layer volatility-driven and carry-driven positions depending on market regime. Start with a correlation matrix to spot tight clusters (e.g., EUR/USD–GBP/USD) and pick a balancing pair from a different cluster (e.g., USD/JPY or USD/CHF). Then decide whether you want volatility diversification (short-duration, tradeable reactions to shocks) or carry diversification (longer-duration, yield-driven returns) and size positions with clear risk controls.Correlation-based diversification: reading coefficients and practical thresholds
- What to use: Calculate Pearson correlations on daily returns over
30/60/90-daywindows. - Practical thresholds: >0.7 (highly correlated — avoid adding both), 0.3–0.7 (moderately correlated — consider partial exposure), <0.3 (low/uncorrelated — good for diversification).
- Timeframes:
30-daycaptures recent regime shifts,60-daysmooths noise,90-dayshows structural relationships. - Step-by-step rebalancing example:
- Identify current exposures: e.g., 40% EUR/USD, 30% GBP/USD, 30% AUD/USD.
- Compute
30/60/90correlations and flag pairs >0.7. - Trim overlapping positions: reduce GBP/USD if EUR/USD correlation >0.8.
- Add complementary pair: allocate the freed weight to USD/JPY or USD/CHF with lower correlation.
- Set rebalance cadence: monthly for active traders, quarterly for swing/position traders.
Volatility vs carry strategies: when to pick each
- Volatility diversification: short-term focus — use when realized or implied volatility is elevated; ideal for event trades and hedging tail risk.
- Carry diversification: longer-term focus — choose when yield curves are stable and risk appetite is strong; returns accrue from interest differentials.
- Example allocations and risk controls:
- Balanced tactical mix: 40% carry positions, 40% low-correlation carry/FX crosses, 20% volatility trades (options or short-term directional).
- Risk control: stop-loss discipline of 1.5–3% of NAV per trade, max drawdown rule 6–8% before de-risking, volatility-scaled position sizing (smaller sizes in higher realized vol).
- When to avoid carry trades: rising global risk-off, widening credit spreads, or sudden FX reserve drains — these regimes often unwind carry quickly.
A sample 5-pair correlation matrix and recommended complementary picks to reduce overall portfolio correlation
Key insight: EUR/USD and GBP/USD are tightly correlated, so holding both adds concentrated USD-risk; USD/JPY and USD/CHF offer diversification because their correlations with EUR/GBP crosses are low or negative. Allocating weight from a correlated pair into USD/JPY or USD/CHF reduces portfolio beta to EUR/GBP moves.Pair EUR/USD USD/JPY GBP/USD AUD/USD USD/CHF EUR/USD 1.00 -0.30 0.88 0.65 -0.82 USD/JPY -0.30 1.00 -0.28 -0.20 0.15 GBP/USD 0.88 -0.28 1.00 0.70 -0.75 AUD/USD 0.65 -0.20 0.70 1.00 -0.60 USD/CHF -0.82 0.15 -0.75 -0.60 1.00 If you want a practical framework and tools to run these correlation scans, RandFX’s market analysis tools and strategy workshops walk through the exact calculations and position-sizing templates traders use to implement this approach. Open an account with to test diversified strategies if you want to run live experiments with multi-pair allocations. Understanding these principles lets you build portfolios that respond differently across market cycles and keeps risk under tighter control.
Risk Management: Position Sizing, Correlation, and Stress Testing
Position sizing controls how much of your capital is at risk on any trade; adjusting that size for correlation turns individual trade risk into realistic portfolio exposure. Using
ATRto scale position size gives you a volatility‑sensitive entry: larger ATR → smaller size, smaller ATR → larger size. When you hold multiple pairs that move together, multiply individual position exposures by their correlation to compute effective exposure; otherwise you under- or over-estimate portfolio risk. Stress testing then asks: which historical or hypothetical shocks would break your risk limits, and how would your positions behave under those shocks?How to size positions using ATR and adjust for correlation
- Measure volatility: use a 14‑period ATR in pips to set per‑trade stop distance.
- Define risk: set a target percent of account equity you’re willing to lose (e.g., 1%).
- Convert to position size: compute lots so that
stop pips × pip value × lots = target risk. - Adjust for correlation: for correlated pairs, multiply nominal exposure by the correlation coefficient to get effective exposure and cap portfolio exposure accordingly.
Worked numeric example
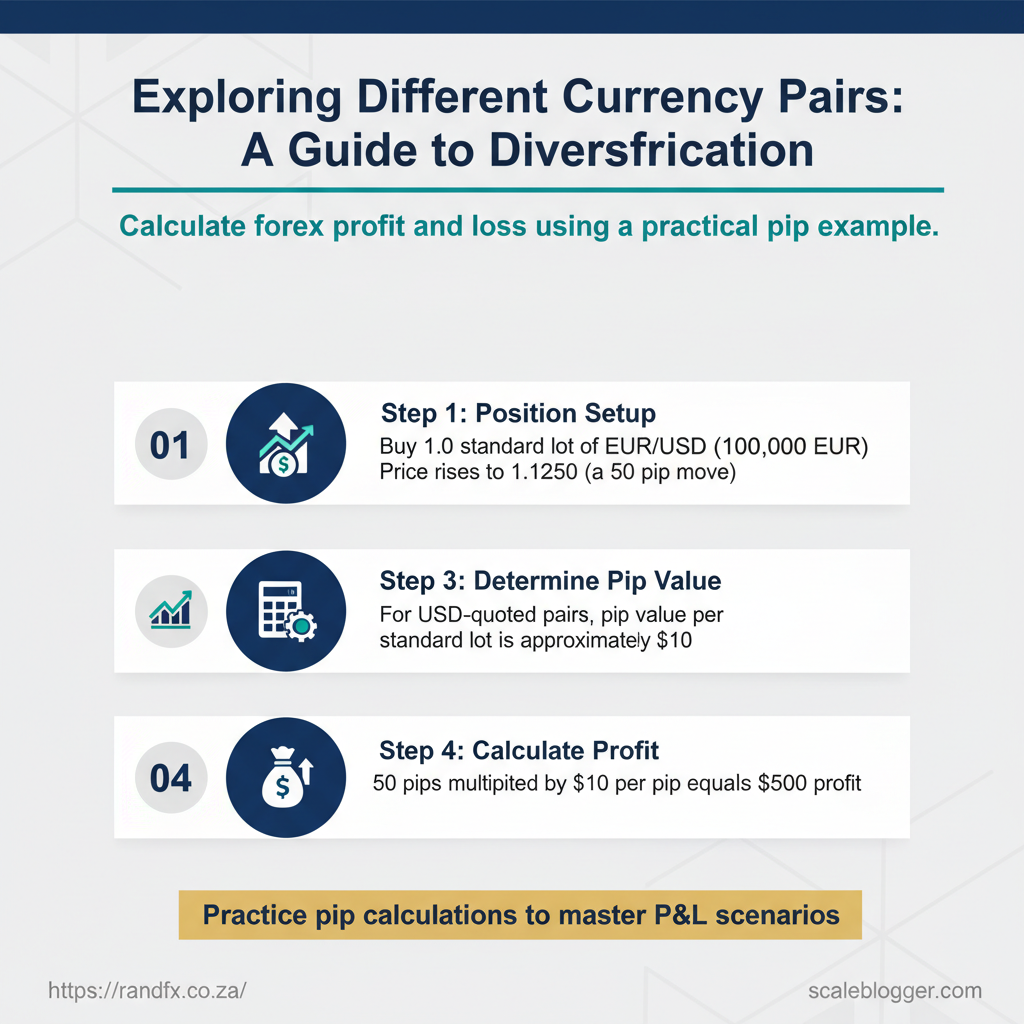
- Inputs: Account equity $50,000; target risk 1% ($500); ATR = 80 pips; EURUSD pip value ≈ $10 per standard lot for 1.00 lot.
- Calculated position size:
lots = target_risk / (ATR_pips × pip_value)⇒500 / (80 × 10) = 0.625 lots. - Correlation adjustment: if holding EURUSD and GBPUSD at 0.85 correlation, effective exposure = 0.625 + (0.625 × 0.85) = 1.156 lots equivalent; trim sizes so combined effective exposure ≤ your chosen cap.
Inputs and outputs for a position-sizing example (equity, ATR, leverage, correlation, position size, expected risk)
Key insight: using ATR normalises size to current volatility, and adjusting for correlation prevents unintended concentration when pairs move together.Input/Output Value Units Notes Account equity $50,000 USD Trading capital Target % risk per trade 1% % $500 risk per trade ATR (pips) 80 pips 14‑period ATR example Calculated position size (lots) 0.625 lots Using $10/pip standard lot Leverage (used) 50:1 ratio Margin affects required margin, not risk calc Correlation (EURUSD vs GBPUSD) 0.85 coefficient High positive correlation Effective exposure after correlation 1.156 lots equiv. Nominal + correlated exposure Expected max loss (if ATR hit) $500 USD Matches target risk assumption Stress testing and scenario planning
- Pick historical events: include 2008-style liquidity shocks, 2015 FX flash events, and recent geopolitical moves that affected your pairs.
- Create hypothetical scenarios: rapid 3% adverse move in base currency, two‑day gap through stops, or simultaneous central bank surprise.
- Run the test: reprice positions at scenario moves and calculate portfolio drawdown, margin impact, and required margin calls.
Template checklist for stress testing
- Define scope: which pairs, timeframes, and account sizes to include.
- Select scenarios: 3 historical + 3 hypothetical.
- Calculate impacts: price moves, slippage, execution risk.
- Decide actions: hard limits, hedge triggers, or position reductions.
- Document results: store scenario inputs and outcomes for monthly review.
> Market data shows volatility clusters during crisis periods, which makes ATR‑based sizing and correlation checks especially valuable.
If you want to practise these calculations live, open an account with to test diversified strategies or Try XM for multi-asset access and tools; both let you run scenario-driven position sizing on demo accounts. Understanding and regularly stress‑testing position sizing and correlation keeps risk visible and decisions disciplined—so you can trade with clearer limits and fewer surprises.
📥 Download: is a good place to start, and you can also explore the RandFX learning resources if you want guided lessons on pair selection and risk management.
- Majors: