

Risk-Reward Ratios: Optimizing Your Forex Trading Strategy
Risk-reward ratio shapes every trade decision, from position size to exit planning. Mastering it helps you protect capital, spot better setups, and tune your edge so profitable months stack rather than evaporate.
Industry research shows disciplined RR frameworks separate casual traders from consistent performers, and traders who plan for asymmetric wins tend to survive drawdowns better. Below are practical angles we’ll cover and tools to put the ideas into action.
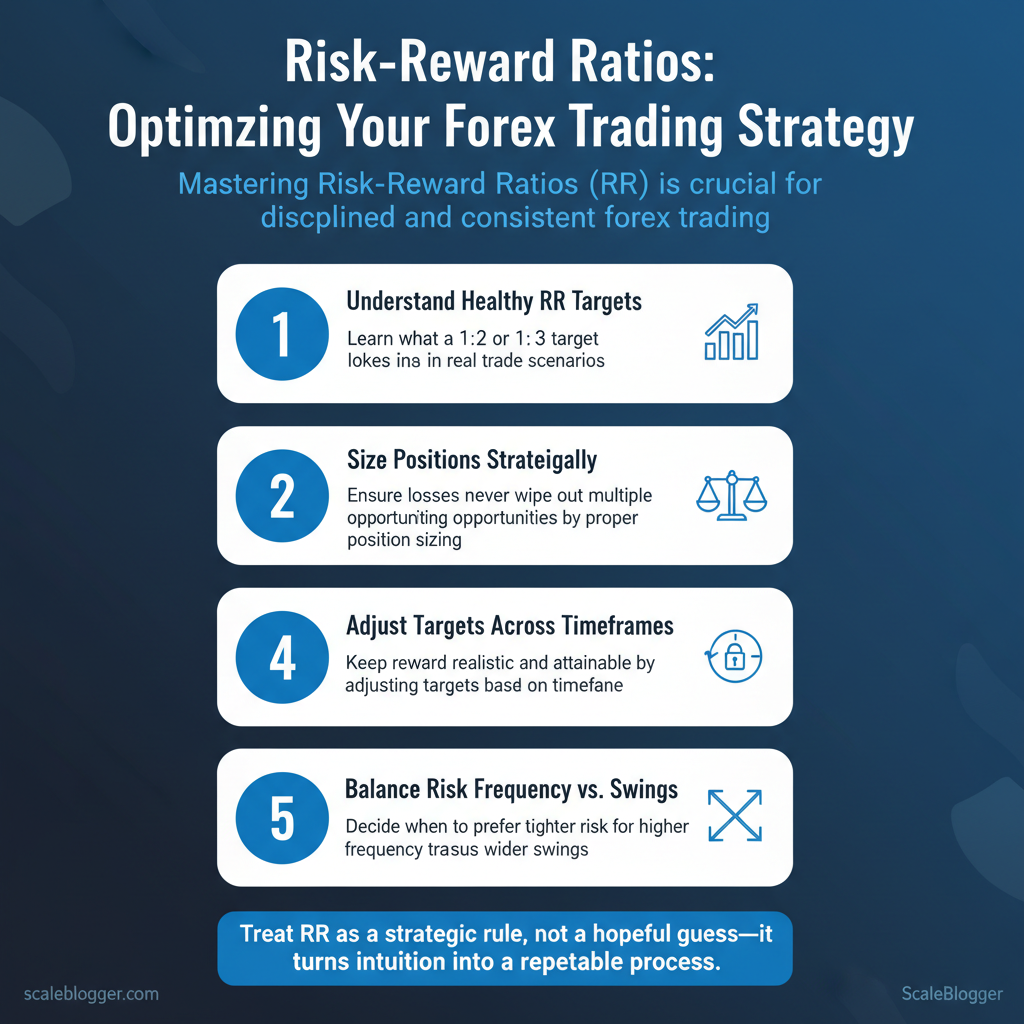
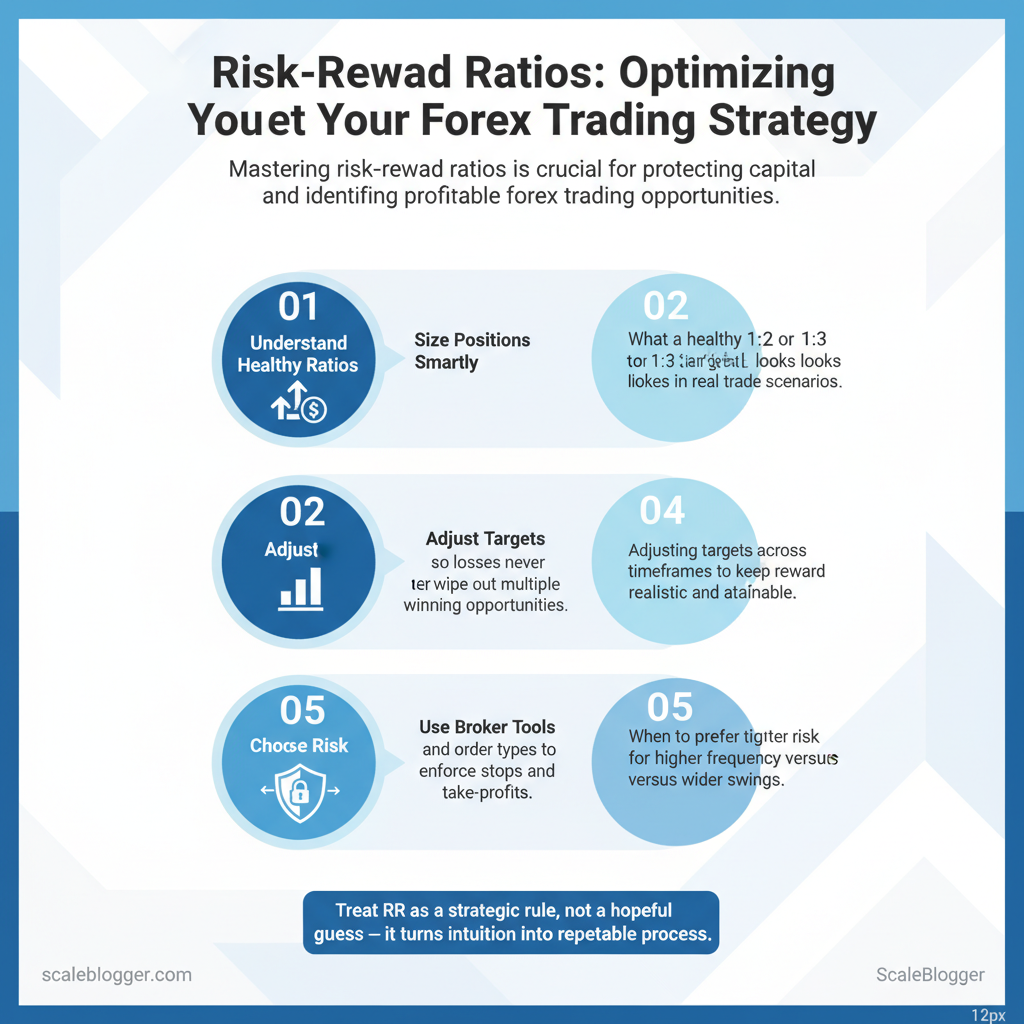
- What a healthy
1:2or1:3target looks like in real trade scenarios - How to size positions so losses never wipe out multiple winning opportunities
- Adjusting targets across timeframes to keep reward realistic and attainable
- Using broker tools and order types to enforce stops and take-profits
- When to prefer tighter risk for higher frequency versus wider swings
> Treat RR as a strategic rule, not a hopeful guess — it turns intuition into repeatable process.
Explore how different brokers support risk management and compare platforms now: Compare forex brokers in South Africa. Try educational tools at XM, consider advanced order types with HFM, or open flexible accounts with FBS to test your sizing rules.
Ready to move from concepts to execution? Open an account with Exness to start applying disciplined RR strategies in live conditions: https://one.asdghq.link/a/ukg6l91d
Table of Contents
- Understanding Risk-Reward Ratio: Basics and Math
- Section Content
- Choosing the Right Risk-Reward Ratio for Your Strategy
- Position Sizing and Risk Management Using RR
- Integrating Risk-Reward with Trading Strategy and Tools
- Common Pitfalls and Psychological Factors
- Measuring Performance and Iterating on RR Rules
- Conclusion
Understanding Risk-Reward Ratio: Basics and Math
Risk-reward ratio measures how much you stand to gain compared with what you stand to lose on a trade. In forex terms, risk is the distance from your entry to the stop-loss (expressed in pips, then converted to monetary value), and reward is the distance from entry to your take-profit. Traders use the ratio to screen setups: a 1:3 ratio means you expect three times the reward for every unit of risk, so you can be profitable even with a lower win rate.
How to think about it practically:
- Risk (pips) — the difference between
entry priceandstop-loss. - Reward (pips) — the difference between
take-profitandentry price. - Position sizing converts pips into money, so the same pip risk means different dollar/ZAR exposure depending on lot size and pair.
Step-by-step calculation (with the formula):
- Calculate pip distances:
risk_pips = |entry - stop_loss|,reward_pips = |take_profit - entry|. - Compute ratio:
risk_reward_ratio = reward_pips / risk_pips(express as1:xorx:1depending on convention). - Convert pip risk to currency:
monetary_risk = risk_pips pip_value_per_lot position_size_lots. - Factor in spreads, commissions and swaps:
effective_risk = monetary_risk + spread_cost + expected_swapbefore sizing the trade.
Practical tips: check your broker’s pip-value convention for exotic pairs, and always include spread in the effective entry. Position-sizing must reflect the monetary risk you’re willing to accept (e.g., 1% of account equity). If your broker offers guaranteed stops or advanced order types, those can materially change your effective risk—consider brokers with strong risk-management features. Consider HFM for risk-management features if you need advanced stop options.
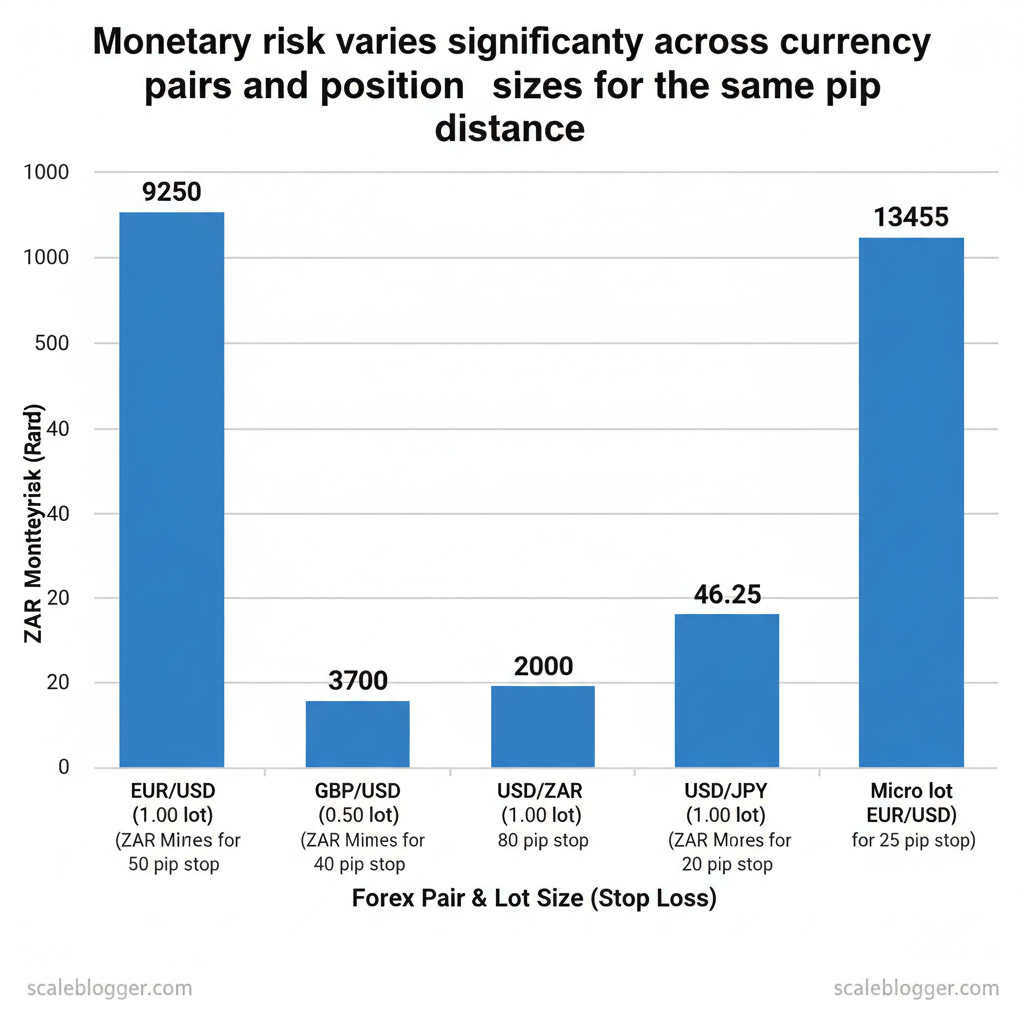
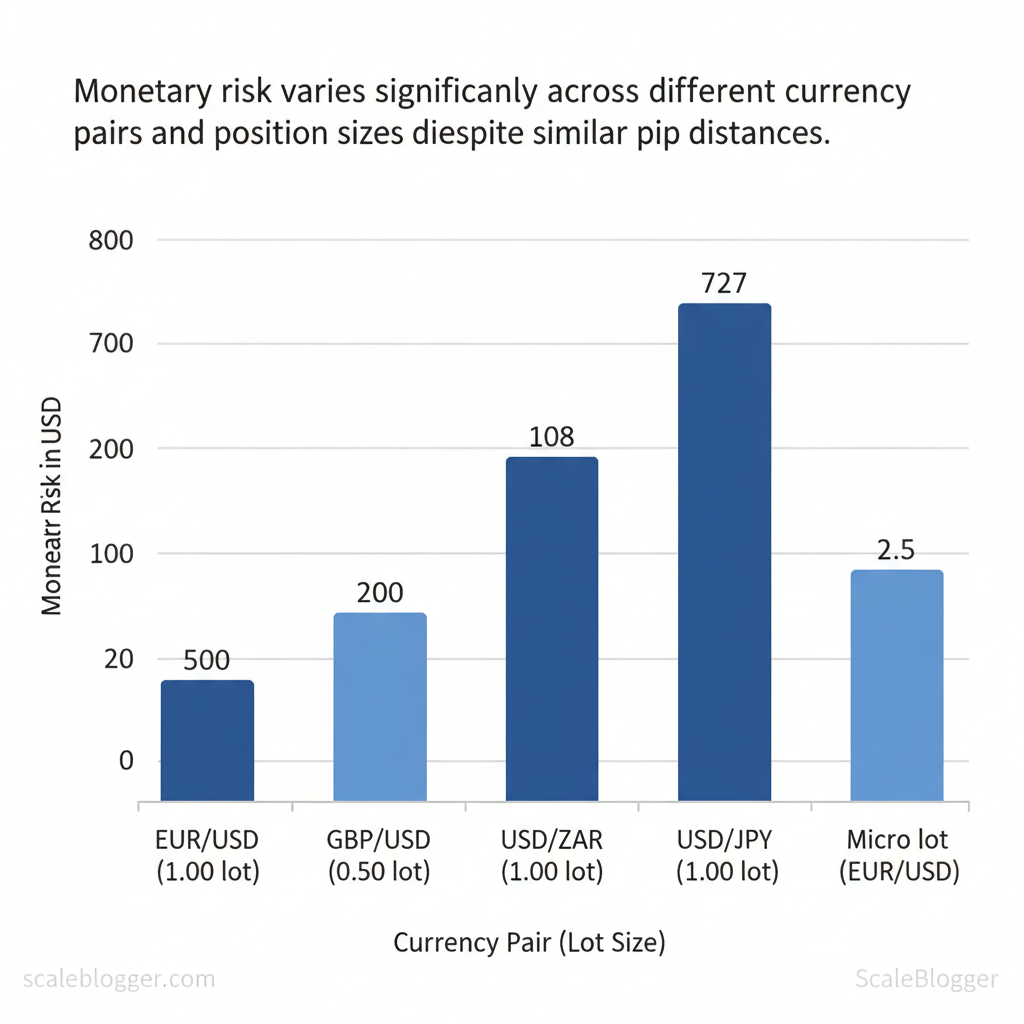
Numeric examples converting pips to monetary risk for different position sizes and currency pairs
| Currency Pair | Entry Price | Stop Loss (pips) | Take Profit (pips) | Position Size (lots) | Monetary Risk (ZAR/USD) |
|---|---|---|---|---|---|
| EUR/USD | 1.1000 | 50 | 150 | 1.00 | ZAR 9,250 / $500 |
| GBP/USD | 1.3000 | 40 | 120 | 0.50 | ZAR 3,700 / $200 |
| USD/ZAR | 18.5000 | 200 | 600 | 1.00 | ZAR 2,000 / $108 |
| USD/JPY | 110.00 | 80 | 240 | 1.00 | ZAR 13,455 / $727 |
| Micro lot (EUR/USD) | 1.1000 | 25 | 75 | 0.01 | ZAR 46.25 / $2.50 |
If you’d like, I can convert these rows to different account currencies or show how changing position size or stop distance affects the required account equity for a given % risk. You can also Compare forex brokers to match trade execution and fees to your risk-management plan.
📥 Download: Risk-Reward Ratio Trading Checklist (PDF)
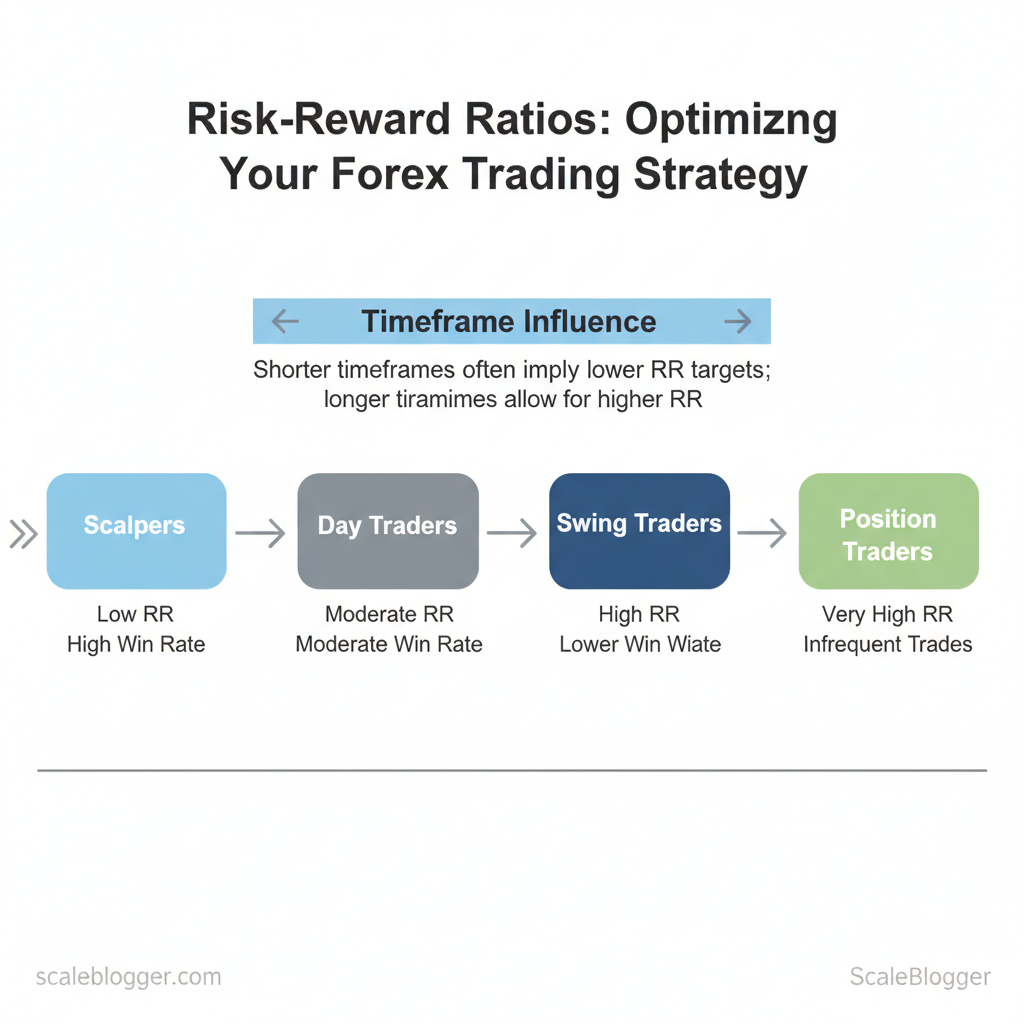
Choosing the Right Risk-Reward Ratio for Your Strategy
Choosing a risk-reward (RR) ratio isn’t a one-size-fits-all decision — it depends on your timeframe, edge, and how reliably you can execute. For quick contexts: scalpers often accept low RR because they need a very high win rate; swing traders can target larger RR because setups are rarer and moves are bigger. Spread, slippage and commission change the effective RR at short timeframes, so you must factor those costs into position sizing.
Match RR to your style:
- Scalpers: tiny targets, tight stops — require high win rates and near-zero execution errors.
- Day traders: moderate RR; aim for repeatable setup patterns and controlled slippage.
- Swing traders: larger RR feasible; fewer trades, accept lower win rate.
- Position traders: high RR per trade with infrequent entries, focus on macro drivers.
- Algo/EA trading: depends on strategy ensemble — many low-RR trades or fewer high-RR trades calibrated by backtest metrics.
Balancing Win Rate and Risk-Reward: Expectancy Formula Expectancy determines whether a system makes money long term. Use Expectancy = (WinRate AvgWin) - (LossRate AvgLoss) to see if your plan is profitable before risking capital. A low win rate paired with high RR can still produce positive expectancy; likewise, a high win rate with tiny RR can fail once costs are included.
- Track real trade outcomes in a log (entry, stop, target, commissions, slippage).
- Calculate
WinRate,AvgWin, andAvgLossfrom real trades. - Compute
Expectancyand iterate on RR or rules until expectancy is comfortably positive.
> Industry analysis shows many retail scalpers need win rates above 60–70% to offset tight RRs and costs; swing systems often succeed with win rates below 50% when RR is 2:1 or higher.
Example: WinRate = 40% (0.40) AvgWin = 2R LossRate = 60% (0.60) AvgLoss = 1R Expectancy = 0.402R - 0.601R = 0.8R - 0.6R = 0.2R per tradeRecommended risk-reward ranges by trading style and typical win-rate expectations
| Trading Style | Typical Timeframe | Recommended RR Range | Expected Win Rate | Notes |
|---|---|---|---|---|
| Scalping | Seconds–minutes | 0.2:1 – 0.8:1 | 60% – 80% | High costs sensitivity; spreads/slippage crucial |
| Day Trading | Minutes–hours | 0.8:1 – 1.5:1 | 50% – 65% | Repeatable setups, intraday volatility matters |
| Swing Trading | Days–weeks | 1.5:1 – 3:1 | 35% – 55% | Larger moves allow bigger RR; fewer trades |
| Position Trading | Weeks–months | 2:1 – 5:1+ | 30% – 50% | Macro exposure, wider stops, lower trade frequency |
| Algorithmic/EA | Varies | 0.5:1 – 3:1 (strategy-dependent) | 40% – 70% | Backtest to balance frequency, drawdown, slippage |
Practical tips: measure win rate from live/demo logs (not optimistic backtests), include spreads/commissions when calculating AvgWin and AvgLoss, and run sensitivity checks on expectancy under worse-than-average win rates. If you want help calibrating a strategy and running expectancy-backed sizing, compare forex brokers to ensure execution and costs align with your timeframe and consider HFM for risk-management features; if you’re looking to practice with an educational broker and calculators, try XM for forex trading. Understanding these principles helps you choose a ratio that fits your edge and keeps risk controlled while pursuing consistent returns.
Position Sizing and Risk Management Using RR
Start by thinking of position sizing as the practical expression of your risk tolerance: how much of your account you’re willing to risk on a trade given the stop and the reward target. Use the risk/reward (RR) to convert a planned stop distance into a position size that keeps your maximum-per-trade loss within limits.
Position sizing methods — how to apply them practically:
| Position Sizing Methods (position sizing forex risk management) | |—|
Position sizing methods, pros/cons and ideal use-cases
| Sizing Method | How it Works | Pros | Cons | Best For |
|---|---|---|---|---|
| Fixed Fractional | Risk a fixed % of account per trade (e.g., 1% of ZAR100,000 = ZAR1,000) | Simple, disciplined, easy to calculate | Doesn’t account for volatility | Beginner to intermediate discretionary traders |
| Full Kelly | f = (bp - q)/b using win rate p and win/loss ratio b |
Maximises geometric growth theoretically | Highly aggressive, volatile drawdowns | Theoretical sizing, not recommended as-is |
| Fractional Kelly | Use 0.25–0.5 × Kelly to reduce risk |
Preserves growth edge while lowering drawdowns | Still depends on accurate edge estimates | Systematic traders who can estimate edge |
| ATR-based Volatility Sizing | Size proportionally to ATR so risk in currency units is constant across volatility regimes |
Adapts to market volatility, reduces over-sizing in noisy markets | Requires ATR smoothing choices and calibration | Volatility-aware traders, breakout/mean-reversion strategies |
| Fixed Lot Sizing | Trade same lot each time regardless of stop size | Operationally simple, good for micro accounts | Ignores actual risk per trade | Micro accounts or when platform constraints exist |
- Fixed fractional example (ZAR/USD account): account =
ZAR100,000, risk =1%→ risk amount =ZAR1,000. If stop =50 pipsand pip value =ZAR2/pip, position size =ZAR1,000 / (50
Kelly needs reliable p (win rate) and b (win/loss multiple). Industry practice is to use fractional Kelly (e.g., 0.25–0.5×) because full Kelly amplifies drawdowns.1% account. If pip value known, compute units accordingly.Setting stops and take-profits practically
- Use technical structure for stops — recent swing lows/highs, support/resistance, trendlines.
- Avoid arbitrary pip stops — justify stops with visible structure or volatility bands.
- Align take-profit with structure or measured moves (e.g., previous range, Fibonacci extension).
- Use RR to sanity-check: prefer trades where
RR ≥ 1.5–2.0when edge is uncertain. - Trailing stops: move stop to breakeven only after proven momentum (e.g., after price reaches 0.5–1.0× target).
> Market practitioners recognise that volatility-aware sizing reduces surprise drawdowns during regime shifts.
Checklist before placing a trade:
- Reason for trade — setup / edge defined.
- Stop — exact price justified by structure.
- Target — specific level and method.
- RR — calculated (e.g., 1:2).
- Position size — calculated in units and lots.
- Contingency — rules for partial exits or stop adjustments.
Template example: Account ZAR100,000 | Risk 1% = ZAR1,000 Entry = 14.2000 | Stop = 14.1500 (50 pips) | TP = 14.3000 (100 pips) Pip value = ZAR2 → Size = 1,000 / (50*2) = 10,000 unitsIf you want model calculators or course materials that walk through these templates step-by-step, Compare forex brokers can help you pair an appropriate broker with your strategy, and consider HFM for risk-management features if you need guaranteed stops or advanced order types. Try XM for forex trading if you want a platform with integrated educational tools and calculators.
Understanding these principles lets you size trades consistently and protect equity while still capturing edge. When applied correctly, disciplined sizing and structure-based stops make performance reliable and easier to scale.
📥 Download: Risk-Reward Ratio Trading Checklist (PDF)
Integrating Risk-Reward with Trading Strategy and Tools
Good risk-reward practice has to live inside your rules, your platform, and your daily workflow — otherwise good intentions evaporate when markets accelerate. Start by baking RR checks into rule-based templates, then use platform features and calculated automation to make those rules repeatable.
- Rule-Based Strategy Template with RR Checks (6 steps)
- Define setup — market context, timeframe, and trigger pattern.
- Set entry — precise entry condition (price, candle, indicator).
- Determine stop — place a stop that reflects technical invalidation, and record distance.
- Set target(s) — primary and secondary targets; calculate
RR(e.g.,1:2). - RR filter — require minimum RR (e.g., only take trades ≥
1:1.5) before sizing. - Execute & manage — predefine scaling rules, trailing stops, and exit conditions.
Suggested journaling fields (use for every trade)
- Entry: instrument, time, price
- Stop: price, distance (pips)
- Target: price(s), expected RR
- RR: calculated ratio (
1:2) - Position size: units and % of equity
- Outcome: result, p/l, max drawdown
- Notes: trade rationale, emotions, market context
Backtest and demo-test every template. Backtesting reveals edge across market regimes; demo-testing validates execution and slippage assumptions. When live, start small and compare journaled RR distribution to historical expectations.
Tools, Broker Features and Automation (Orders, Alerts, EAs)
- OCO & Guaranteed Stops enforce discipline by combining entry and stop orders or offering fixed-price stop execution under volatility.
- Position-size calculators translate your stop distance and risk per trade into units automatically.
- Trailing stops & alerts let you lock profits without emotional hesitation.
- EAs / strategy automation ensure consistent RR application by executing entries, stops, targets, and scaling rules exactly as defined. Use EAs when your rules are fully deterministic and tested.
Consider platform selection carefully — some brokers offer guaranteed stops and advanced order types that directly support RR discipline. For a quick comparison, see our client tool to Compare forex brokers for features that matter when enforcing RR: https://randfx.co.za/brokers/broker-comparison/ . If you want a broker with built-in calculators and educational tools, Try XM for forex trading: https://clicks.pipaffiliates.com/c?c=487256&l=en&p=1. For advanced guaranteed stops and order types, Consider HFM for risk-management features: https://www.hfm.com/int/en/?refid=192941.
Journal template example: Date | Pair | Entry | Stop | Target | RR | Size | Outcome | NotesIntegrating RR into your rules, tooling, and automation removes guesswork and keeps execution consistent — that’s what turns good plans into repeatable performance.
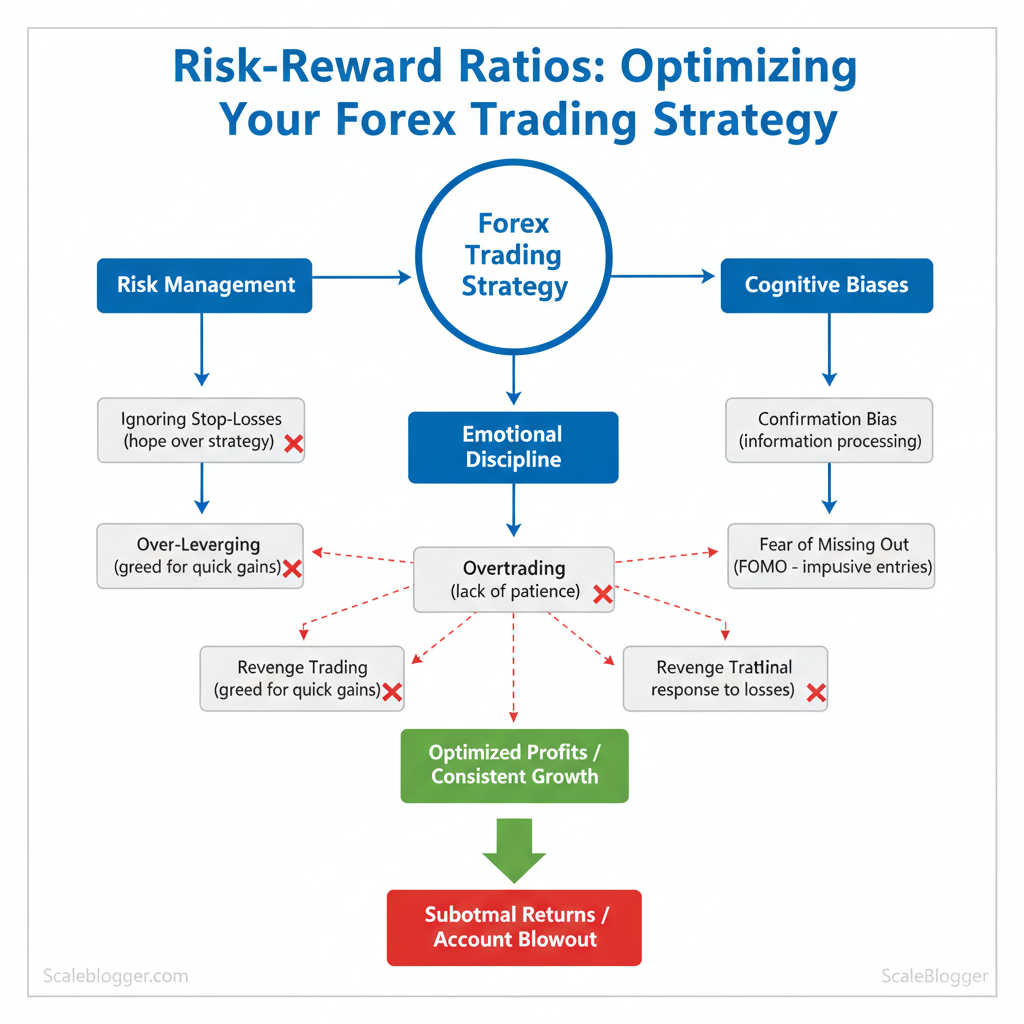
Common Pitfalls and Psychological Factors
Emotional noise and sloppy execution are the two fastest ways to destroy a favourable risk-reward (RR) plan. Traders often know the maths but fall prey to predictable biases that inflate risk or erode edge; pairing behavioral fixes with a strict execution checklist is the fastest counter.
Behavioral biases that undermine RR
- Overconfidence — believing your probability is higher than it is; leads to oversized positions and ignored stop placement. Try
position_size = risk_per_trade / stop_distanceto force discipline. - Loss aversion — holding losers too long and cutting winners early; enforce
OCOorders to remove temptation. - Recency bias — recent wins or losses skew probability estimates; use a fixed lookback sample (e.g., last 50 trades) for performance math.
- Anchoring — sticking to an entry/target from a news headline; write trade plans before major events and lock them in.
- Confirmation bias — seeking evidence that supports the trade; seek disconfirming signals deliberately.
Practical behaviour hacks
- Use a pre-trade checklist and sign it publicly (chat group or trading coach) to create accountability.
- Automate routine actions: set
limit,stop, andOCOif supported to remove in-the-moment decisions — consider brokers with advanced order types; Consider HFM for risk-management features (https://www.hfm.com/int/en/?refid=192941) if you need guaranteed stops and advanced orders. - Keep a trade journal with a simple
cause → plan → outcomestructure and review weekly. - Apply time-based rules (e.g., close at session end) to limit overnight emotional exposure.
- Use a small, fixed slider for position sizing percentage rather than gut feel.
> Industry analysis shows many losing traders fail to combine behavioral controls with execution discipline; both must be addressed.
Pre-trade and execution checklist highlighting items that directly affect RR and realised outcomes
| Checklist Item | Why it matters | Action to take | Verification |
|---|---|---|---|
| Confirm spread and commission | Affects net RR and break-even distance | Check live spread + per-lot commission before entry | Broker fee schedule and live quote on platform |
| Verify pip-to-currency conversion | Ensures correct risk currency sizing | Convert pip value to account currency using platform tool | Platform calculator or spreadsheet (pip_value formula) |
| Set stop and target orders (OCO) | Removes emotional exit decisions | Place stop and limit as OCO at entry |
Confirm OCO accepted in order ticket |
| Confirm position size | Prevents over-risking | Calculate using risk% * equity / stop_pips |
Position-size calculator or platform order preview |
| Review macro/news events | Slippage and volatility risk | Check economic calendar 1 hour before trade | Live economic calendar and broker news feed |
📥 Download: Forex Trading Risk-Reward Ratio Checklist (PDF)
Measuring Performance and Iterating on RR Rules
Start by treating your RR (risk-reward) rules as hypotheses: you want to know whether a particular RR cutoff or sizing rule improves real outcomes across many trades, not just a few lucky wins. Build a trade-log that makes derived metrics trivial to compute and focus on the metrics that actually change decision-making.
Key metrics and tracking basics
- Win Rate — proportion of closed trades that were profitable.
- Average Win / Average Loss — mean profit and mean loss per trade, in pips or account currency.
- Expectancy — long-run expected return per trade, combines win rate and average win/loss.
- Average RR — average realised reward:risk on closed trades.
- Trade count and exposure time — sample size and how long positions stay open.
- How to structure tests for RR changes
- Define a single variable to change (e.g., shift minimum RR from
1:1to1.5:1). - Use split-sample or temporal A/B: run new RR rule on paper trades or a dedicated account segment while keeping the original rule live elsewhere.
- Keep other inputs constant: position sizing method, entry rules, trade management.
- Predefine success criteria (e.g., improved expectancy by ≥5% with p>0.8 practical confidence).
- Decide roll-out conditions: only deploy to live capital after ≥100 trades or 3 months of stable improvement, whichever comes later.
> Industry analysis shows performance signals stabilize only after moderate sample sizes — tiny samples produce wildly misleading win rates.
Table: Example trade-log summary table showing derived metrics and how they’re calculated from raw trades — forex trading metrics expectancy win rate
| Metric | Formula | Example Value | Interpretation |
|---|---|---|---|
| Win Rate | #wins / #trades |
46 / 100 = 46% |
Below 50% but may still be profitable if wins >> losses |
| Average Win | sum(wins) / #wins |
85 pips |
Indicates upside when trades work; used in expectancy |
| Average Loss | sum(losses) / #losses |
-45 pips |
Size of losing trades; key to sizing and stops |
| Expectancy | ((WinRate AvgWin) + ((1-WinRate) AvgLoss)) |
(0.4685)+(0.54-45)= 3.1 pips |
Positive expectancy → sustainable edge given consistent sizing |
| Average RR | AvgWin / abs(AvgLoss) |
85 / 45 = 1.89 |
Shows typical reward secured relative to risk taken |
Practical iteration tips
- Log everything — include entry reason, stop, target, size, and emotional notes.
- Avoid small samples — aim for 80–200 trades per test depending on strategy frequency.
- Use paper/live split — test longer on paper, then a small live allocation before full rollout.
- Automate metrics — compute
ExpectancyandAverage RReach week to spot drift. - Review quarterly — discard or refine RR rules that degrade expectancy consistently.
If you want to compare brokers or practical ways to test live with low friction, you can always Compare forex brokers (https://randfx.co.za/brokers/broker-comparison/). For hands-on practice with demo-to-live transitions try XM for forex trading (https://clicks.pipaffiliates.com/c?c=487256&l=en&p=1) and consider HFM for risk-management features (https://www.hfm.com/int/en/?refid=192941). Understanding these measurement and iteration practices shortens the path from hypothesis to reliable rules you can trade with confidence. When tests are run cleanly, you make disciplined changes rather than chasing noise.
📥 Download: Forex Trading Risk-Reward Ratio Checklist (PDF)
Conclusion
You now have a clearer sense of how risk-reward shapes position size, stop placement, and exit plans — and why consistently applying a disciplined ratio beats guesswork. Traders who pair strict position sizing with defined stop-losses tend to see smaller drawdowns and steadier equity growth, while adapting targets to market context preserves win-rate without chasing volatility. If you’re still wondering how tight stops should be, or when to accept smaller wins, start by backtesting a few 1:2 and 1:3 scenarios and tracking outcomes over 50–100 trades to see what aligns with your psychology and account size. Consider pairing that practice with expert guidance to shorten the learning curve.
For a practical next step, compare broker features, spreads and execution models so your chosen setup can be executed reliably — start with Compare forex brokers in south africa. If you want structured learning alongside that, explore the RandFX courses and resources for expert-led instruction that helps turn these principles into repeatable results.