

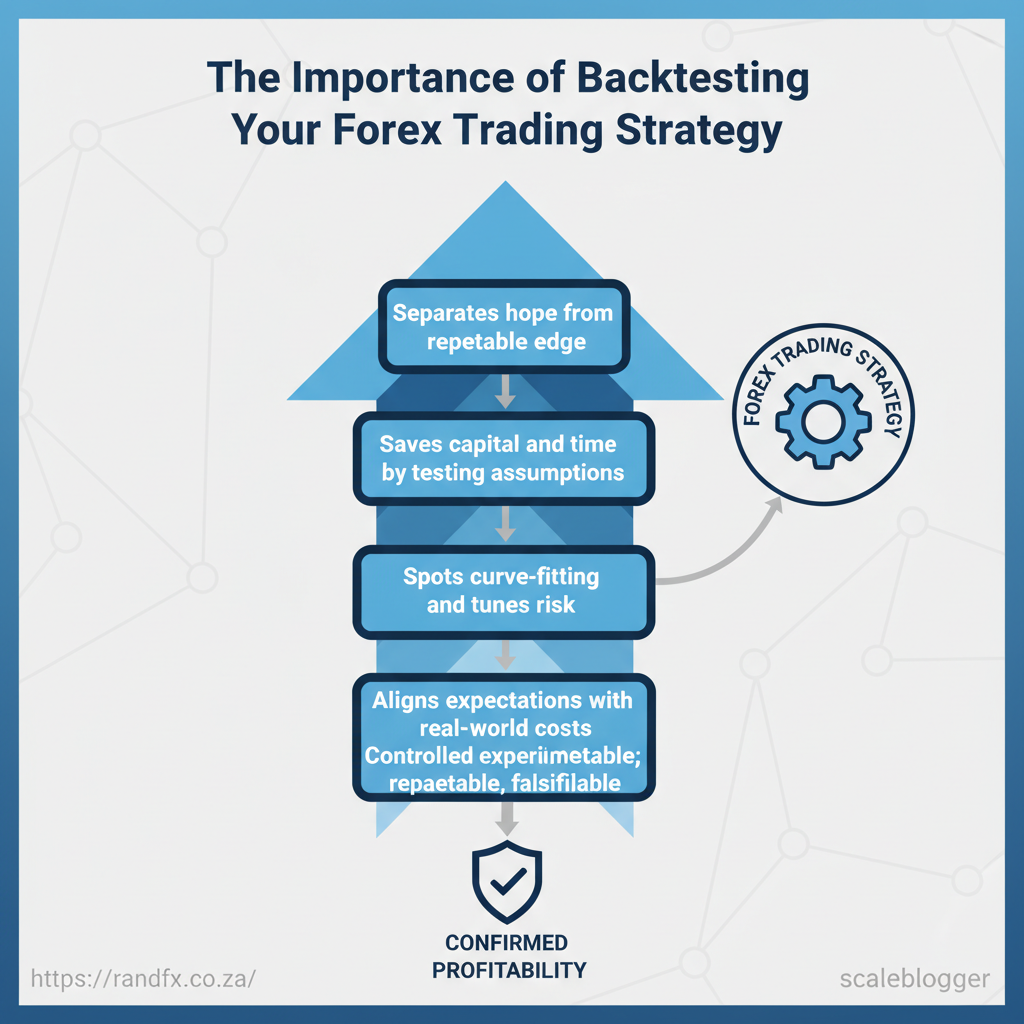
Backtesting is the disciplined rehearsal of your forex strategy against historical data to see how it would have performed, and it separates hope from repeatable edge. It matters because assumptions about execution, spreads, and slippage often crumble in live markets, and testing ahead of time saves capital and time. As traders who value evidence over intuition, we use backtests to spot curve-fitting, tune risk, and align expectations with real-world costs.
- What reliable backtesting looks like and why model realism matters
- How to incorporate execution factors like
spread,commission, andslippageinto results - Practical checks to avoid overfitting and false confidence
- Ways to validate backtests with live-sim execution using recommended brokers
> Treat backtesting as controlled experimentation: measurable, repeatable, and falsifiable.
RandFX helps traders compare execution and cost assumptions across brokers so your backtest translates to live performance. Test your results with Exness, XM, HFM, or FBS to validate spreads and fills in demo accounts: Open a demo or live account with Exness, Try XM for low-cost account types, Consider HFM for ECN account testing, FBS.
When you’re ready to match backtest assumptions to execution and cost, start by comparing brokers that fit your strategy. Compare forex brokers in South Africa: https://randfx.co.za/brokers/broker-comparison/
Table of Contents
- What is Backtesting and Why It Matters
- Section Content
- Preparing Data and Tools for Accurate Backtests
- Designing a Robust Backtesting Methodology
- Interpreting Results and Improving Strategy Robustness
- From Backtest to Live: Deployment and Monitoring
- Common Pitfalls and How to Avoid Them
- Conclusion
What is Backtesting and Why It Matters
Backtesting is the process of running a trading strategy against historical market data to see how the rules would have performed. At its core, backtesting is a historical simulation: you codify your entry, exit, position sizing and risk rules, feed them price, volume and spread history, and observe the simulated trades. That simple loop answers whether a set of rules would have produced profits, losses, and how often trades would have occurred.
Practical core principles to apply when you backtest:
- Clean data is essential — use continuous price series, correct timeframes, and remove bad ticks. Dirty data creates false signals.
- Include transaction costs — model
spread,commissions, and slippage so results reflect realistic P&L. - Use realistic order types — simulate market and limit fills, and partial fills where relevant.
- Account for survivorship bias — avoid datasets that drop failed instruments, which artificially inflate results.
- Test multiple market regimes — run tests across trending, range-bound and high-volatility periods.
- Log everything — trade-level records enable analysis of adverse scenarios and rule-level failures.
What backtesting reliably shows and what it cannot guarantee:
- Backtesting shows historical profitability patterns, trade frequency, and rough risk characteristics; however, it cannot guarantee future returns.
- Backtesting surfaces implementation issues — for example, whether your rules trigger at realistic times and how often execution would be required.
- Backtesting helps identify parameter sensitivity and the potential for overfitting when small changes collapse performance.
Combine backtesting with forward-looking checks:
- Split data and perform out-of-sample or walk-forward testing to validate stability.
- Run a
paperor demo account to measure real-world execution and latency. - Move to a small live allocation with strict risk controls before scaling.
If you need a practical place to validate execution assumptions, try opening a demo or live account with Exness to test spreads and fills in your target market, or try XM for low-cost account types and consider HFM for ECN account testing. For a broker feature comparison, you can also Compare forex brokers to match execution characteristics to your strategy. Using these steps keeps expectations realistic and connects historical results to live feasibility.
What backtesting shows versus what it doesn’t, to set realistic expectations for traders
| Aspect Tested | Backtesting Strength | Backtesting Limitation | Mitigation/Next Step |
|---|---|---|---|
| Profitability | Shows historical net returns after modeled costs | Past profits don’t predict future performance | Use out-of-sample testing and demo trading |
| Drawdown Behavior | Reveals magnitude and duration of historical drawdowns | May understate future stress during unseen regimes | Stress-test with worst-case scenarios |
| Execution Feasibility | Estimates number of trades and likely fills under modeled spreads | Historical fills may differ from live fills and latency | Validate via demo or small live account (broker testing) |
| Robustness Across Markets | Identifies if rules worked in different currency pairs/periods | May fail in new correlations or regime shifts | Walk-forward tests across multiple instruments |
| Sensitivity to Parameters | Shows which parameters critically affect results | Overfitting risk when many parameters tuned to historical noise | Use parameter stability tests and penalize complexity |
Understanding these principles helps traders move faster without sacrificing quality. When implemented correctly, this approach reduces surprise in live trading and makes scaling decisions much more disciplined.
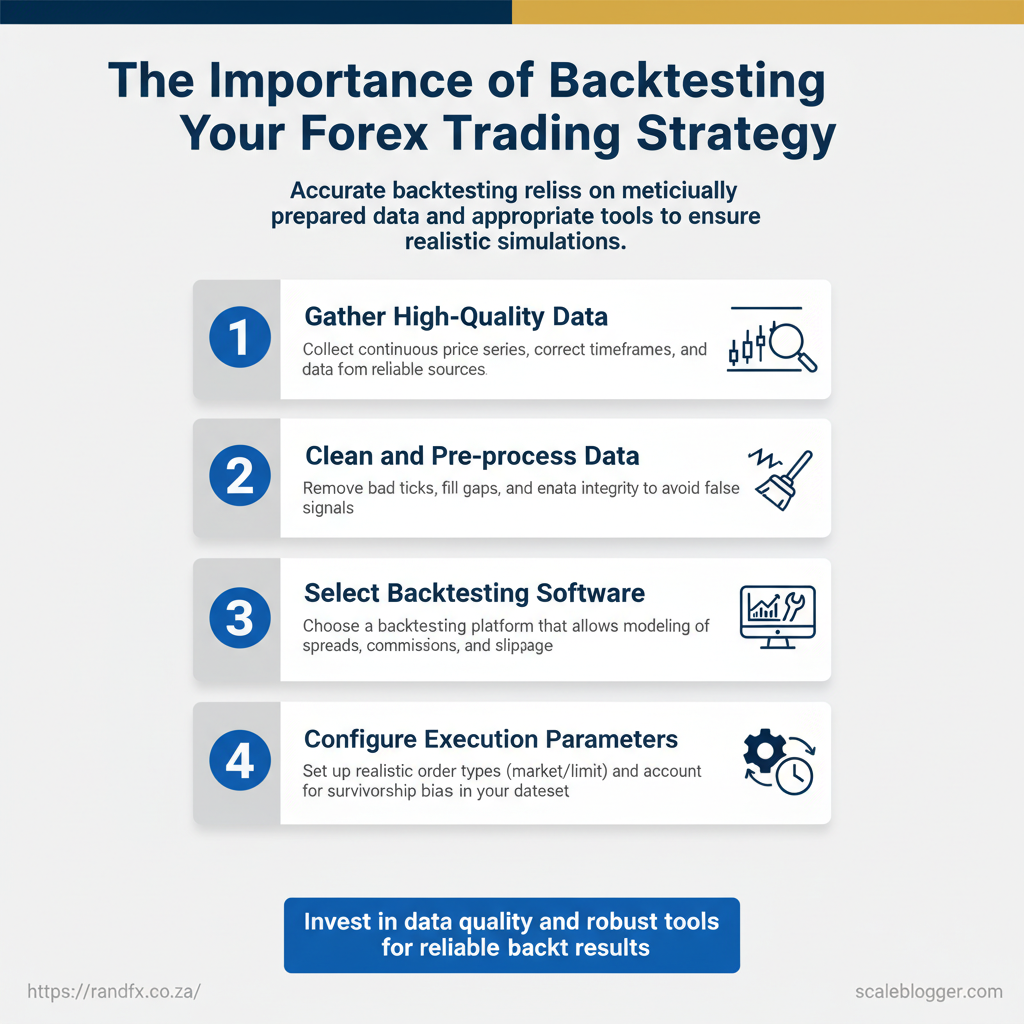
Preparing Data and Tools for Accurate Backtests
Start by matching your data choice to the strategy you plan to test. For execution-sensitive systems (scalping, HFT, spread arbitrage) you need tick data and realistic execution/latency assumptions; for swing or position strategies, minute or daily OHLC is usually sufficient. Verify continuity and timezone alignment with your broker, adjust for market holidays, and normalise for corporate events where applicable — otherwise your edge will look better on paper than it is in live conditions.
Selecting and cleaning historical data — practical steps:
- Confirm required granularity (
tick,1m,5m,1h,daily) based on execution sensitivity. - Remove bad candles and fill small gaps with interpolation; flag and investigate large gaps.
- Align timestamps to your broker’s timezone and trading session (EET, GMT, etc.) using
pytzorpandastimezone conversion. - Adjust for daylightsaving shifts and market holidays; exclude non-trading days from performance metrics.
- Add realistic slippage and spread models rather than assuming mid-price fills.
When choosing tools and platforms, weigh ease of prototyping versus scalability and execution realism. For quick ideation, TradingView’s visual backtests (Pine Script) are efficient; for production-ready systems and large datasets, Python stacks (pandas, Backtrader, vectorbt) provide the control you need. If you want an integrated retail route, MetaTrader platforms are ubiquitous and let you script in MQL for automated forward testing.
Useful checklist items to keep handy:
- Verify continuity across sessions and instrument symbols.
- Normalize spreads to reflect live account types.
- Automate cleaning so each backtest run uses the same preprocessing.
- Document assumptions (slippage, commissions, order types) with each result.
If you need help selecting brokers or validating execution assumptions, you can Compare forex brokers on RandFX, or Open a demo or live account with Exness to test spreads directly. Try XM for low-cost account types if you want an alternate execution profile. Consider HFM for ECN account testing where order-routing matters.
Data types and their suitability for different strategy types
| Data Type | Granularity | Suitable Strategy Types | Pros | Cons |
|---|---|---|---|---|
| Tick Data | Tick-by-tick | Scalping, execution-sensitive | Highest realism, exact spread modelling | Very large files, slow to process |
| 1-Minute OHLCV | 1-minute bars | Intraday, short-term strategies | Good balance speed/accuracy | Misses intra-minute microstructure |
| 5/15/60-Minute OHLCV | 5/15/60-minute bars | Swing/intraday strategies | Faster backtests, smaller datasets | Lower execution fidelity |
| Daily OHLC | Daily bars | Swing/position trading | Fast, simple, long-term view | No intraday signals, coarse entries |
| Monthly OHLC | Monthly bars | Macro/asset allocation | Best for long-term tests, low noise | Not usable for tactical timing |
Side-by-side features comparison of common backtesting tools and platforms, helping readers choose the right tool
| Platform | Scripting Language | Best For | Cost | Ease of Use |
|---|---|---|---|---|
| MetaTrader 4 (MT4) | MQL4 | Retail EA development | Free platform; broker spreads apply | Moderate — GUI backtester, limited data |
| MetaTrader 5 (MT5) | MQL5 | Multi-asset/backtesting | Free; advanced journal/logging | Moderate — better than MT4 for testing |
| TradingView (Pine Script) | Pine Script | Visual strategy ideation | Free tier; Pro $14.95/mo+ | High — quick visual feedback |
| Backtrader (Python) | Python (pandas) | Custom, rigorous testing | Open-source (free) | Moderate–high — coding required |
| Amibroker | AFL | Fast local backtests | One-time license ~$339 | High — powerful, steeper learning |
Understanding these principles helps teams move faster without sacrificing quality. When implemented consistently, they make your backtests a reliable foundation for live deployment.
Designing a Robust Backtesting Methodology
Start by making every rule and variable explicit and codable. A backtest is only as honest as the assumptions you encode: entry triggers, exit logic, position sizing, and risk controls must be written so a script can reproduce them without interpretation.
- Define rules clearly. Spell out signals (
cross of EMA(50) over EMA(200)) and filters (ATR(14) > 0.0015) inpseudocodeso implementation and peer review are straightforward. - Make trade management actionable. Include stop loss, take profit, trailing logic, partial exits, and rules for re-entry; e.g.,
on hit SL -> reduce position by 50% and re-evaluate after 3 bars. - Position sizing matters as much as signals. Use fixed fractional sizing, volatility parity, or
risk-per-trademethods and record equity curve sensitivity to size choices. - Model execution realistically. Include spreads, slippage distributions, and order types (market vs limit) — execution quality often explains the gap between backtest and live performance. Consider verifying assumptions by opening a demo or live account with Exness to test real spreads and fills.
- Implement robust risk controls. Max drawdown limits, daily loss caps, and correlation caps between strategies limit tail risk and prevent ruin.
- Prepare data: clean, timezone-aligned, and free of look-ahead leaks.
- Implement rules in code with deterministic RNG seeds for reproducibility.
- Run initial in-sample development using conservative assumptions.
- Validate with the techniques below, iterate parameters only with proper controls.
- Record full trade logs and provenance for every backtest run.
Example rule snippet:
python if ema50.crosses_above(ema200) and atr14 > threshold: size = equity risk_per_trade / (entry_price - stop_price) place_order('limit', size, entry_price)Validation Techniques: Walk-Forward, Monte Carlo, and Out-of-Sample
Validation techniques, their purpose, pros/cons, and recommended use cases (walk forward testing forex)
| Technique | Purpose | Strengths | Limitations | When to Use |
|---|---|---|---|---|
| Out-of-Sample Testing | Test strategy on holdout data not used for tuning | Simple, clear check against overfitting | Single split can be lucky/unlucky | Early validation after development |
| Walk-Forward Optimization | Re-train and test over sequential windows | Simulates live re-calibration; measures stability | Computationally intensive; needs many windows | Strategies that require periodic re-optimization |
| Monte Carlo Simulation | Stress test sensitivity to trade order, size, and P&L shocks | Reveals tail risks and sequence sensitivity | Requires many simulations; depends on realistic perturbations | Assess robustness to rare events and sequence risk |
| Bootstrap Resampling | Create alternative trade sequences by resampling history | Keeps empirical return characteristics; quick | Destroys time-dependence and serial correlation | Quick robustness checks for return distribution |
| Time-Series Cross-Validation (rolling) | Multiple train/test splits preserving order | Uses more data for validation; better variance estimate | More complex to implement; can be noisy | When data non-stationarity is a concern |
If you want help turning these rules into runnable code or a repeatable testing pipeline, RandFX offers trading strategy development and market analysis tools that speed implementation and reduce common validation mistakes. Also consider Try XM for low-cost account types to validate spread-sensitive strategies, and Compare forex brokers to benchmark execution assumptions against live venues.
When done well, these practices let you rely on backtests as decision-grade evidence rather than wishful thinking. Understanding and formalizing these steps helps teams move faster without sacrificing quality.
Interpreting Results and Improving Strategy Robustness
Start by interpreting backtest numbers like a diagnostic report: some metrics tell you whether the engine runs, others whether it will survive a long race. Expectancy and drawdown answer different questions — one about long-term edge, the other about whether your account can endure inevitable losing streaks. Look at them together, not in isolation.
- Expectancy (long-term edge): Use the formula
Expectancy = (win% avgWin) - (loss% avgLoss)to judge whether the system should make money over many trades. A positive expectancy means the statistical edge exists; size position accordingly. - Max drawdown (survivability): This shows the largest peak-to-trough loss and determines capital needs and psychological durability; plan position sizing so drawdowns don’t force poor decisions.
- Sharpe / Sortino (risk-adjusted returns): Sharpe measures returns per unit of volatility; Sortino focuses on downside volatility — useful when upside volatility is common but you worry about downside risk.
- Profit factor (efficiency): Gross profits divided by gross losses — values above
1.5–2.0indicate reasonable efficiency, but context matters for frequency and market regime.
Stress testing closes the gap between backtest optimism and live reality. Run these robustness checks sequentially to see failure modes and fixable weaknesses:
- Parameter sensitivity: sweep each parameter across wide ranges (not just ±5%) and record performance landscapes.
- Walk-forward validation: simulate re-optimization and out-of-sample trading periods to avoid overfitting.
- Price noise & slippage: add synthetic tick-level noise and realistic slippage distributions to PnL.
- Spread widening: test worst-case spreads and asymmetric spreads during news events.
- Execution delays: model order latency and partial fills to capture execution risk.
- Scenario stress: force sequences like consecutive losses, correlated market moves, or liquidity droughts.
- Monte Carlo resampling: randomize trade order and returns to estimate confidence intervals for drawdown and longevity.
- Combat survivorship bias: ensure data covers delisted pairs and all historical tick samples.
A few practical tips: when parameter sweeps show narrow peaks, the strategy is fragile; widen filters or simplify rules. If slippage kills the edge, consider reducing trade frequency, using limit orders, or testing with an ECN-style account. To validate execution and spreads in live-like conditions, Open a demo or live account with Exness or Try XM for low-cost account types; Consider HFM for ECN account testing. If you want comparative context for brokers before testing, Compare forex brokers on our site to match the account type to your strategy.
Key backtest metrics, formulas, and why they matter for decision-making
| Metric | Formula / Calculation | Interpretation | Suggested Thresholds |
|---|---|---|---|
| Expectancy | Expectancy = (win% avgWin) - (loss% avgLoss) |
Measures average P&L per trade; positive = statistical edge | >0 (preferably >0.01 per trade for frequency systems) |
| Max Drawdown | Peak equity − Trough equity (absolute or % of peak) | Shows worst historical capital loss; guides position sizing | Keep <25% for retail accounts; <10–15% for aggressive sizing |
| Sharpe Ratio | (Mean return − Risk-free) / Std dev of returns | Risk-adjusted return; treats upside and downside equally | >1.0 acceptable, >2.0 strong |
| Sortino Ratio | (Mean return − Target) / Downside deviation | Focuses on downside risk; better for skewed returns | >1.0 acceptable, >2.0 desirable |
| Profit Factor | Gross profits / Gross losses | Efficiency of gross winning vs losing trades | >1.5 acceptable, >2.0 preferred |
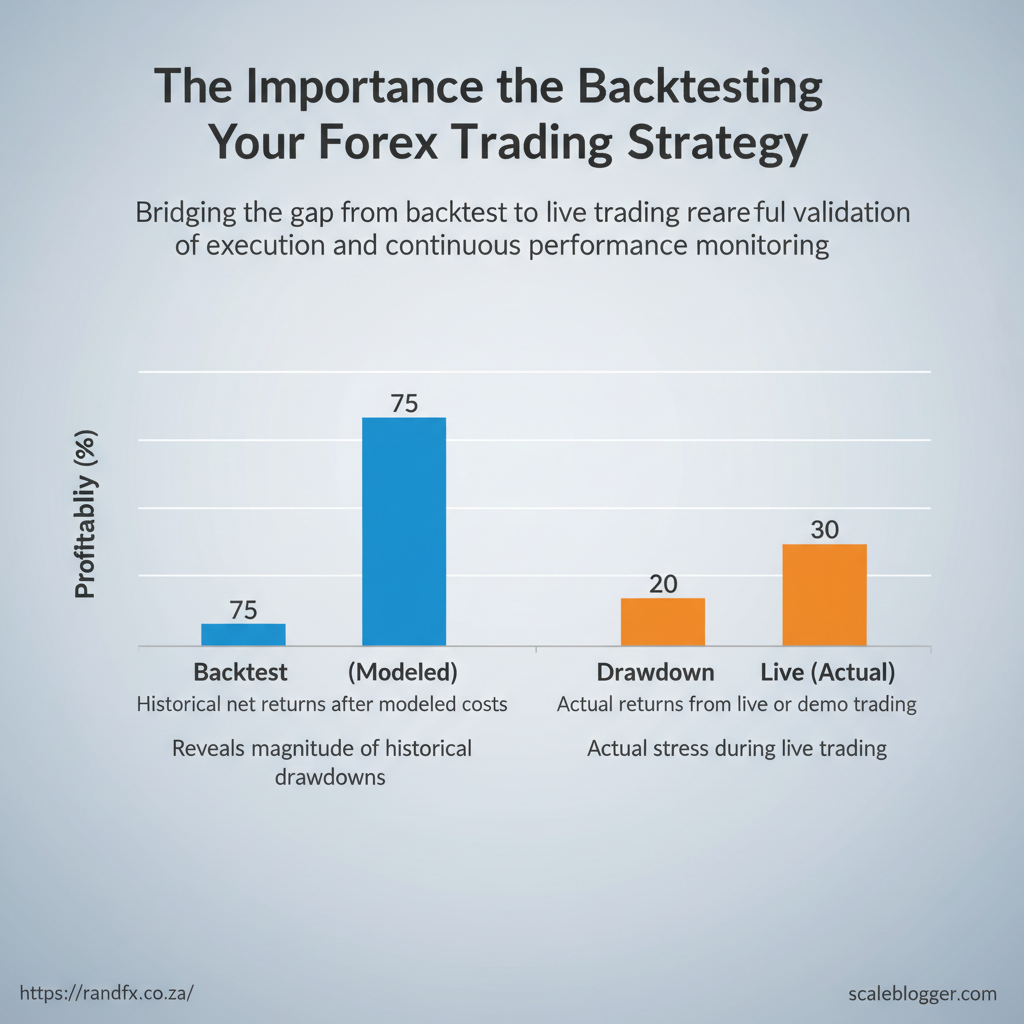
From Backtest to Live: Deployment and Monitoring
The transition from a clean backtest to real money isn’t a flip of a switch — it’s a staged experiment designed to validate execution assumptions and control risk while you learn how the market and your broker behave in live conditions. Start by replicating live spreads, slippage, and order types in a realistic demo, then move gradually through scaled capital steps while re-checking the same performance metrics you trusted in the backtest.
Demo Testing and Gradual Live Scaling
- Use the actual broker — execution characteristics vary; validate with the same counterparty you plan to trade. Open a demo or live account with Exness to confirm spreads and fills, and Try XM for low-cost account types as an alternative.
- Replicate market conditions — simulate
marketvslimitorders, variable spread windows, and realistic slippage distributions. - Staged capital ramp — scale in steps rather than lump sums; after each step re-run performance checks and compare to backtest expectations.
- Re-run key metrics — after every scale step, recalculate expectancy, Sharpe, and realized slippage; if any metric deviates beyond your tolerance, pause scaling.
- Start on demo with the target broker and match trading hours.
- Move to micro or low allocation (Step 1) and collect
nlive trades or weeks. - Increase allocation only when monitored metrics align with backtest.
- Continue until Full Allocation is reached or the strategy is retired.
Monitoring, Recalibration, and Governance
- Set alerts for drawdown breaches, slippage spikes, and latency increases; for example
drawdown > historical_max 1.2or slippage >10pips. - Maintain a trading log linking each live trade back to the backtest assumption that justified it, including order type, fill price, and context notes.
- Regular out-of-sample testing — schedule monthly OOS re-runs; retrain or tweak parameters only after statistically significant drift.
- Governance — define an owner, an approval gate for parameter changes, and rollback rules if a metric crosses emergency thresholds.
> Industry analysis shows live execution often reduces theoretical performance by measurable slippage and missed fills.
json { "alert": "drawdown_exceeded", "threshold": "-5%", "action": "notify_trader, pause_new_positions" }Provide a simple risk-scaling roadmap showing capital scale steps and monitoring checkpoints
| Scale Step | Capital Allocation (%) | Required Sample Size (trades or weeks) | Primary Monitoring Metrics |
|---|---|---|---|
| Step 1 | 1% | 100 trades or 4 weeks | fill rate, realized slippage, drawdown |
| Step 2 | 5% | 200 trades or 8 weeks | trade expectancy, win rate, latency |
| Step 3 | 20% | 400 trades or 12 weeks | portfolio drawdown, correlation, slippage spikes |
| Full Allocation | 100% | ongoing monitoring (quarterly) | capacity limits, long-term Sharpe, execution cost |
If you want practical help matching execution assumptions to a broker or building the monitoring rules, Compare forex brokers on our site and consider HFM for ECN account testing or FBS as another live option — each offers account types useful for execution-sensitive validation. Understanding these checks and controls helps you move from promising backtests to robust live performance without unnecessary surprise.
📥 Download: Forex Trading Strategy Backtesting Checklist (PDF)
Common Pitfalls and How to Avoid Them
Overfitting, data-snooping, and curve-fitting show up as stellar in-sample returns that collapse when faced with new data. You’ll spot it when tiny parameter tweaks produce huge performance swings, or when a strategy excels on historical data but fails on a fresh out-of-sample period. To avoid that:
- Limit parameter tuning — keep the number of free parameters small and justify each one.
- Penalize complexity — prefer simpler rules; simpler models generalize better.
- Use honest out-of-sample splits — hold back blocks of contiguous data rather than random samples to preserve market regime structure.
- Apply
walk-forwardtesting — roll the train/test window forward and re-optimize only on the train window. - Use robustness checks — perform Monte Carlo resampling, add noise to prices, and test across multiple instruments/timeframes.
- Track economically meaningful KPIs — focus on risk-adjusted metrics (e.g., Sharpe, Sortino, max drawdown) not just gross returns.
- Document every optimization — record why each parameter was changed and how performance behaves under small perturbations.
- Avoid data-snooping traps — don’t test dozens of hypothesis on the same dataset without correction; treat multiple comparisons as real.
Execution realities and costs are where theoretical edges die. Ignoring commissions, spreads, slippage, and order-type availability inflates live expectations. Always model costs and confirm your broker supports the needed execution.
- Quantify all costs — include commission, average spread, and a slippage assumption per trade in backtests.
- Simulate realistic fills — use liquidity-weighted fills for large orders and model
marketvslimitbehavior. - Validate on a broker — confirm order types, minimal lot sizes, and APIs; execution differences between ECN and MM matter.
- Stress-test latency — run the strategy on delayed/real-time tick playback if available.
- Start small in live testing — use a demo or micro account to validate costs and behavior before scaling.
> “Execution costs can turn a modest edge into a loss if they aren’t measured realistically.”
How different brokerage models affect spreads, commissions, and suitability for strategies
| Brokerage Model | Typical Spread Behavior | Commission Structure | Best For |
|---|---|---|---|
| Market Maker (MM) | Wider, sometimes fixed spreads | Often spread-included, no per-lot commission | Beginner strategies, small accounts |
| ECN / STP | Tighter, variable spreads | Low spreads + per-lot commission (or mark-up) | High-frequency, scalping, professional traders |
| Commission-based ECN | Very tight raw spreads | Transparent fixed per-lot commission (e.g., $3–$7/lot) | Active traders needing low spread |
| Fixed-Spread Accounts | Fixed spreads, can be wider during news | Spread-included; fewer surprises | Simpler budgeting, strategy testing |
| Zero-Spread with Commission | Near-zero quoted spread | Separate commission per lot | Scalpers needing predictable spread costs |
If you want to validate execution and spreads against a real broker, consider opening a demo to test assumptions — Open a demo or live account with Exness or Try XM for low-cost account types, and Consider HFM for ECN account testing. For a broader view, you can also Compare forex brokers on RandFX to match a broker to your strategy. Understanding these principles helps you move faster without sacrificing robustness.
Conclusion
You’ve seen how rigorous backtesting catches hidden assumptions — realistic spreads and slippage, the danger of overfitting, and the need to test parameter stability across different market regimes. Practical examples in the article showed that strategies which survived out-of-sample and walk-forward checks kept returns more consistent, while those tuned only to in-sample data suffered large drawdowns. Make time to clean your data, simulate execution costs, and run walk-forward tests so your edge is repeatable rather than accidental.
If you’re ready to move from theory to a live-ready plan, start by matching your backtest assumptions to a broker and sharpening execution expectations. For an educational boost and help selecting the right partner, explore RandFX’s expert-led courses and then compare execution characteristics and costs by visiting Compare forex brokers in south africa. For further reading on strategy design and risk controls, see the resources on our homepage, which outline practical implementation paths and next steps.